
Table of Contents
Risk Assement
In simple terms, The word “risk” refers to the chance that harm will actually occur, combined with how severe that harm might be. Rather than being a one-off paperwork exercise, the meaning behind a risk assessment is proactive prevention: identifying hazards before an incident happens, rather than reacting after an injury, illness, or property loss. It is a foundational concept in health and safety management, forming the basis for almost every other control measure, procedure, or piece of protective equipment used on site.
Risk Assessment Definition
Formally, a risk assessment is defined as a systematic process of identifying hazards in the workplace, evaluating the likelihood and severity of harm associated with each hazard, and determining suitable control measures to eliminate or reduce that risk to an acceptable level. Regulatory bodies such as the HSE (UK Health and Safety Executive) and OSHA describe it as a legal duty for employers, not simply good practice. The definition typically includes three core elements: hazard identification, risk evaluation (often expressed as likelihood multiplied by severity), and the recording of findings along with the actions taken. A proper risk assessment is documented, reviewed periodically, and communicated to everyone affected by the activity.
Risk Assessment Methods: Definitions, Data Tables & Illustrations
1. Qualitative Risk Assessment
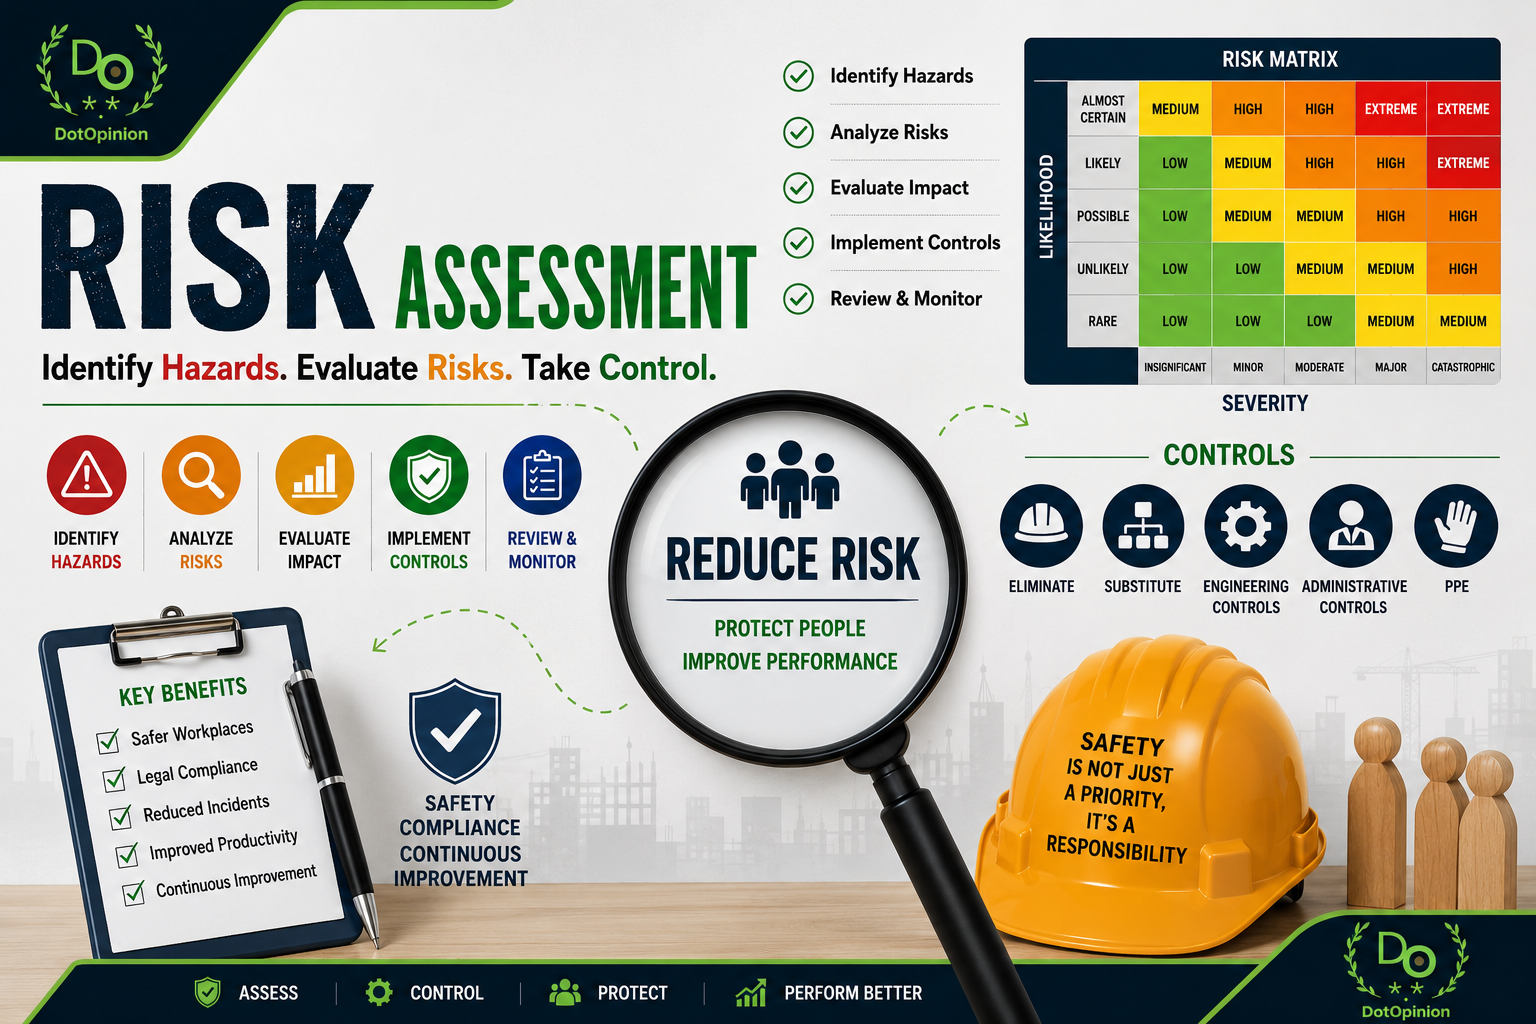
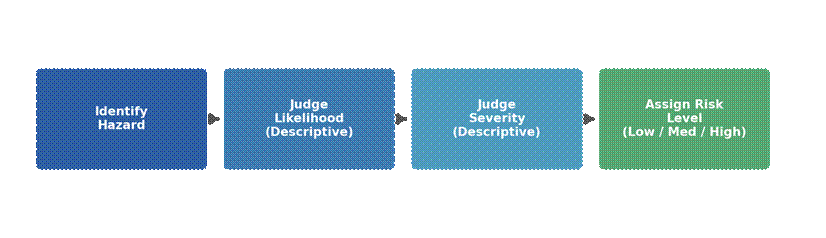
Qualitative risk assessment evaluates hazards using descriptive, judgement-based categories rather than numerical data. Likelihood and severity are ranked using terms such as “rare,” “possible,” “minor,” or “catastrophic,” and the two are combined on a risk matrix to reach an overall rating of Low, Medium, High, or Extreme. This method is fast, requires no specialist statistical training, and is well suited to everyday workplace hazards such as slips, trips, or general office risks. Its main limitation is subjectivity — different assessors may rate the same hazard differently — so organisations rely on clear definitions for each rating band to keep results consistent.
Illustration: Qualitative Assessment Flow
Data Table: Descriptive Risk Matrix
| Likelihood \ Severity | Negligible | Minor | Moderate | Major | Catastrophic |
| Almost Certain | Medium | High | High | Extreme | Extreme |
| Likely | Medium | Medium | High | High | Extreme |
| Possible | Low | Medium | Medium | High | High |
| Unlikely | Low | Low | Medium | Medium | High |
| Rare | Low | Low | Low | Medium | Medium |
2. Quantitative Risk Assessment
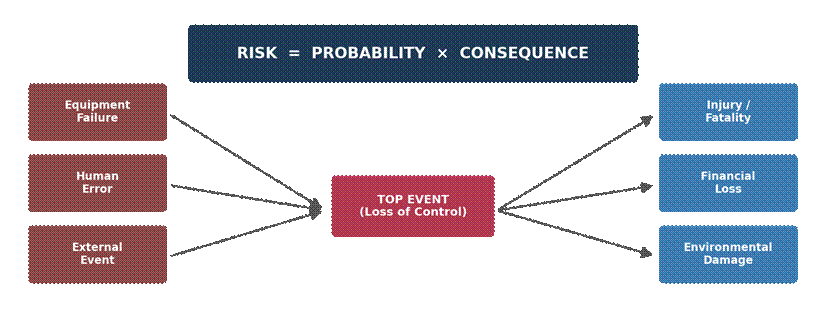
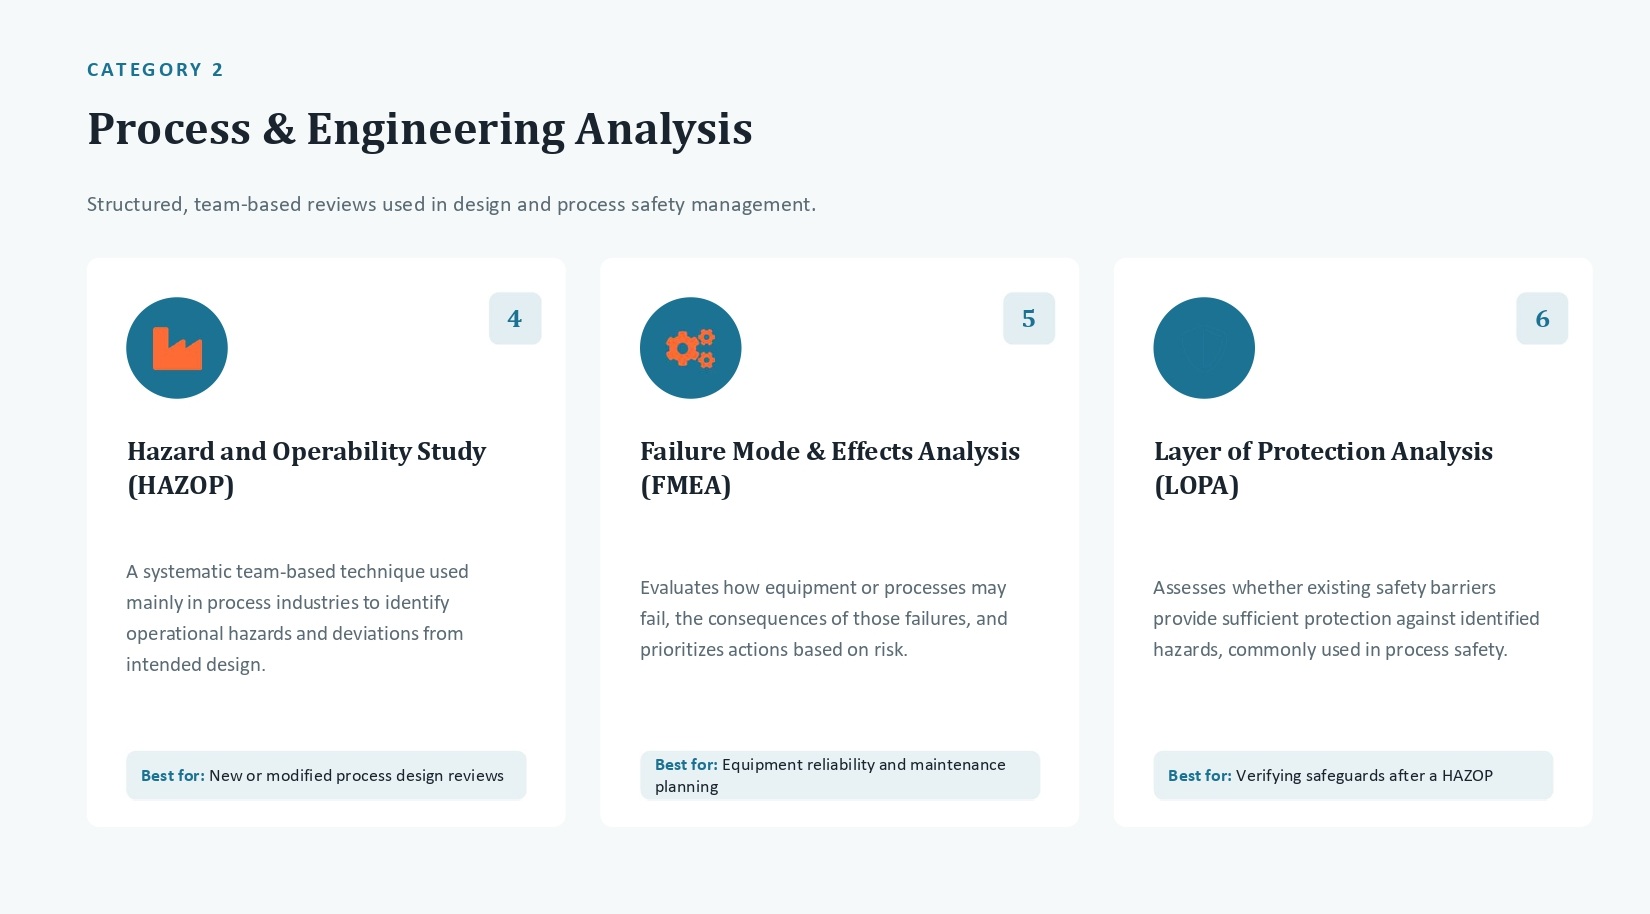
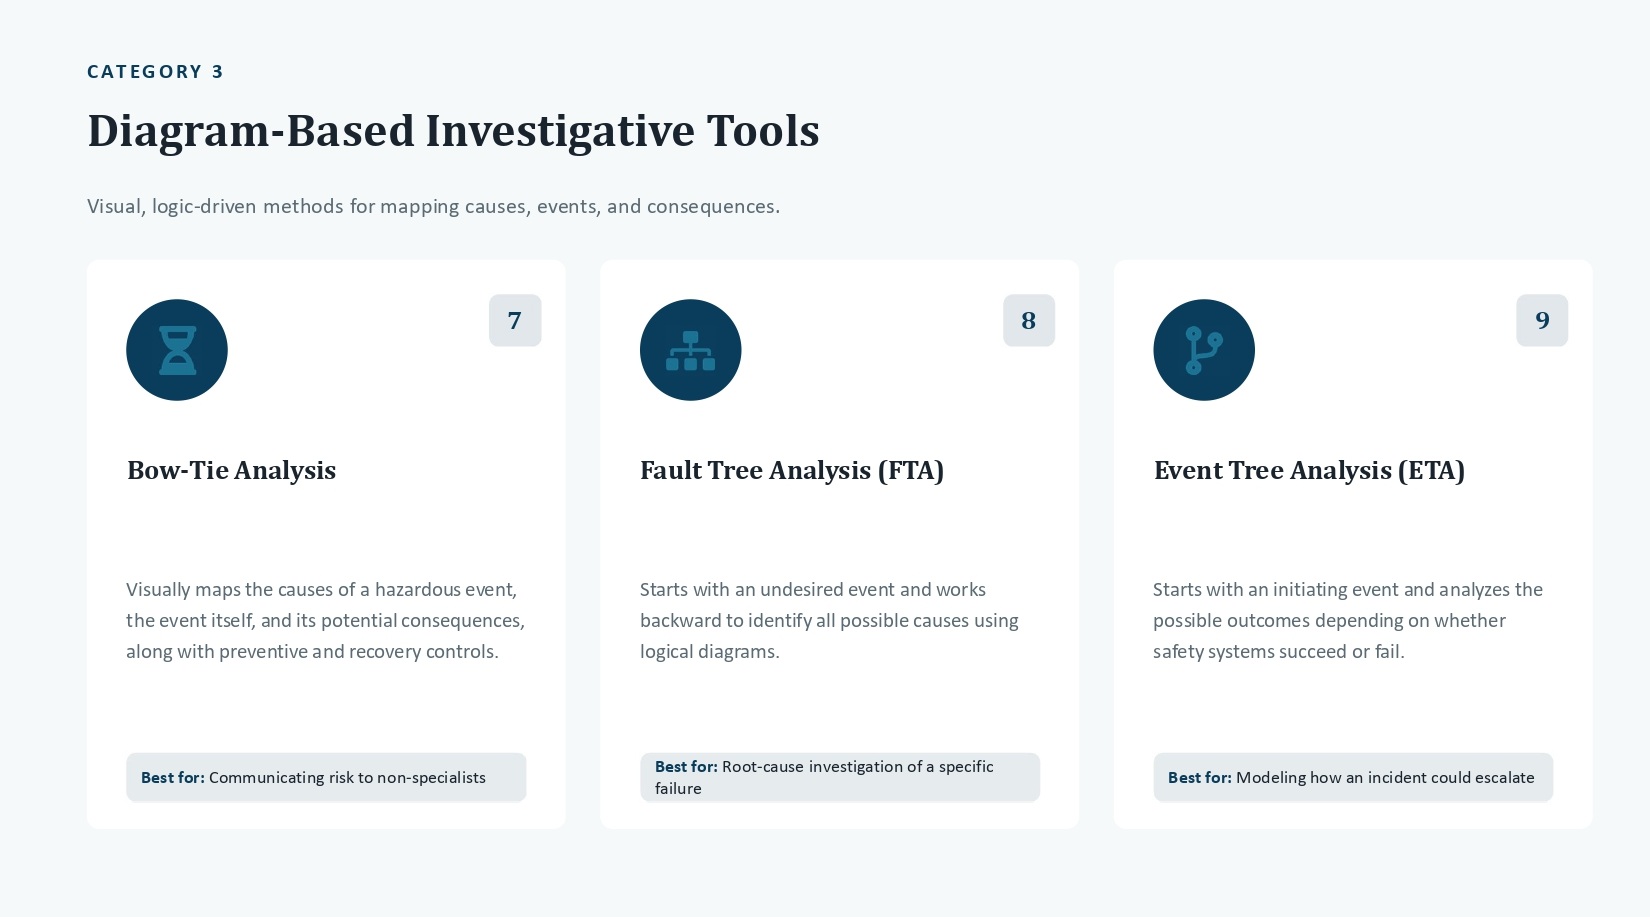
Quantitative risk assessment (QRA) replaces descriptive judgement with measurable data, calculating risk as Probability multiplied by Consequence, where consequence is often expressed in financial terms, injury/fatality rates, or environmental damage units. This approach is standard in high-hazard industries such as oil and gas, aviation, and nuclear power, where regulators require statistically defensible proof that risk has been reduced As Low As Reasonably Practicable (ALARP). QRA draws on historical failure data, incident databases, and engineering models such as bowtie analysis to trace how root causes lead to a top event and onward to specific consequences, allowing precise comparison and prioritisation between different hazards.
Illustration: Risk Formula & Bowtie Diagram
Data Table: Worked Numerical Example
| Hazard | Probability | Consequence | Risk Score (P × C) | Priority |
| Pressure vessel rupture | 1 | 5 | 5 | Critical |
| Forklift collision | 1 | 4 | 4 | High |
| Chemical spill (minor) | 2 | 1 | 2 | Medium |
| Slip on wet floor | 1 | 1 | 1 | Low |
3. Semi-Quantitative Risk Assessment
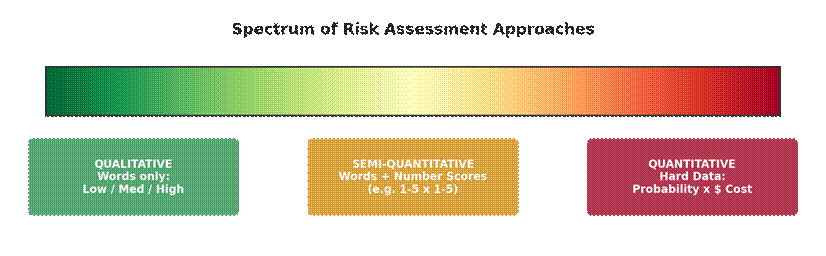
Semi-quantitative risk assessment sits between the two approaches above, applying numerical scores (typically 1–5) to likelihood and severity while still anchoring each number to a plain-language description. Multiplying the two scores produces a risk value, commonly 1–25, which is then grouped into bands such as Low, Medium, High, and Extreme — combining the speed of qualitative judgement with the added consistency and comparability of numbers. This is the most widely used method in general industry because it is quick to apply on site yet gives management enough granularity to rank hazards and justify resource allocation, without requiring the extensive statistical data that full QRA demands.
Illustration: Spectrum of Approaches
Data Table: Score Definitions
| Score | Likelihood Descriptor | Frequency Range | Severity Descriptor | Impact Range |
| 1 | Rare | < once per 10 years | Negligible | First aid only |
| 2 | Unlikely | Once per 5–10 years | Minor | Medical treatment, no lost time |
| 3 | Possible | Once per 1–5 years | Moderate | Lost time injury |
| 4 | Likely | Several times a year | Major | Hospitalisation / permanent injury |
| 5 | Almost Certain | Monthly or more often | Catastrophic | Fatality or multiple fatalities |
4. HIRAC (Hazard Identification, Risk Assessment, and Control)
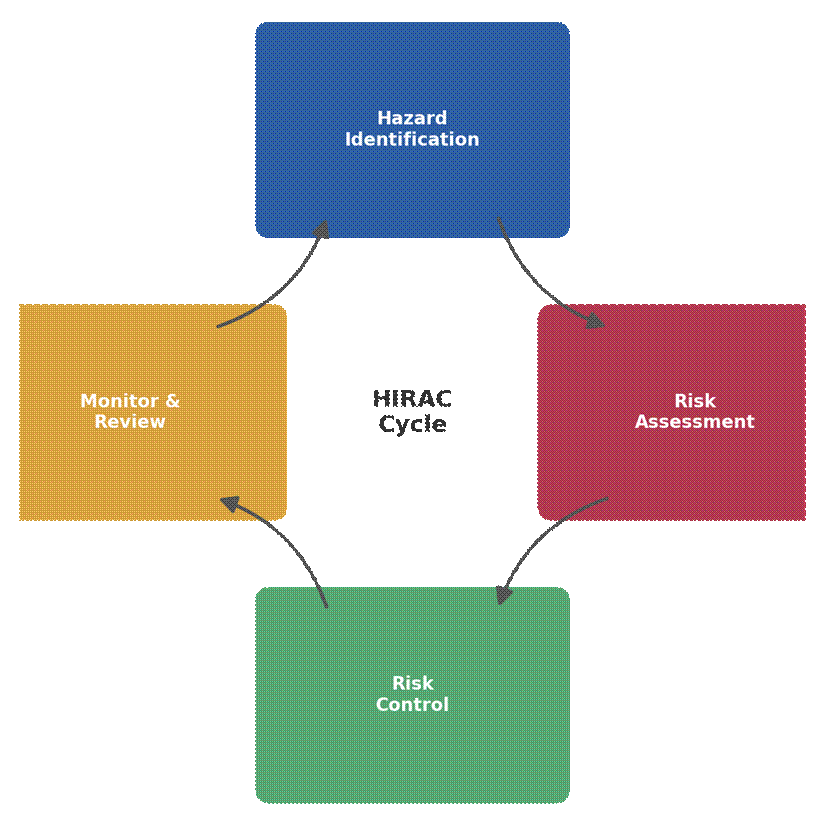
HIRAC is a structured methodology, and often a formal management-system requirement, that combines three linked activities into a single continuous cycle: identifying hazards, assessing the associated risk, and implementing suitable controls. Unlike a one-off assessment, HIRAC is designed to run as an ongoing loop, closing with a monitor-and-review stage that feeds back into hazard identification, ensuring the process stays current as tasks, equipment, or regulations change. HIRAC registers are commonly used in manufacturing, construction, and process industries as the master record linking every identified hazard to its current control status, the residual risk remaining, and the person accountable for further action.
Illustration: The HIRAC Cycle
Data Table: Sample HIRAC Worksheet — “Operating a Forklift”
| Activity | Hazard | Risk (L×S=R) | Control Measures | Residual Risk |
| Loading pallets | Collision with pedestrian | 4×4=16 (High) | Segregated walkways, horn on reverse, spotter | 2×4=8 (Medium) |
| Raising forks | Load fall / tip-over | 3×5=15 (High) | Load limit checks, seatbelt use, operator certification | 2×5=10 (Medium) |
| Refuelling | Fire / fuel spill | 2×4=8 (Medium) | Designated refuelling area, spill kit, no smoking signage | 1×4=4 (Low) |
5. JSA / JHA (Job Safety Analysis / Job Hazard Analysis)
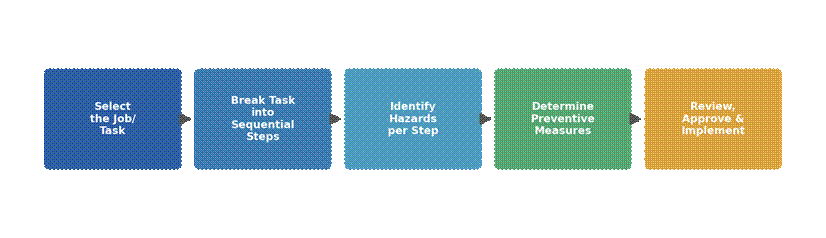
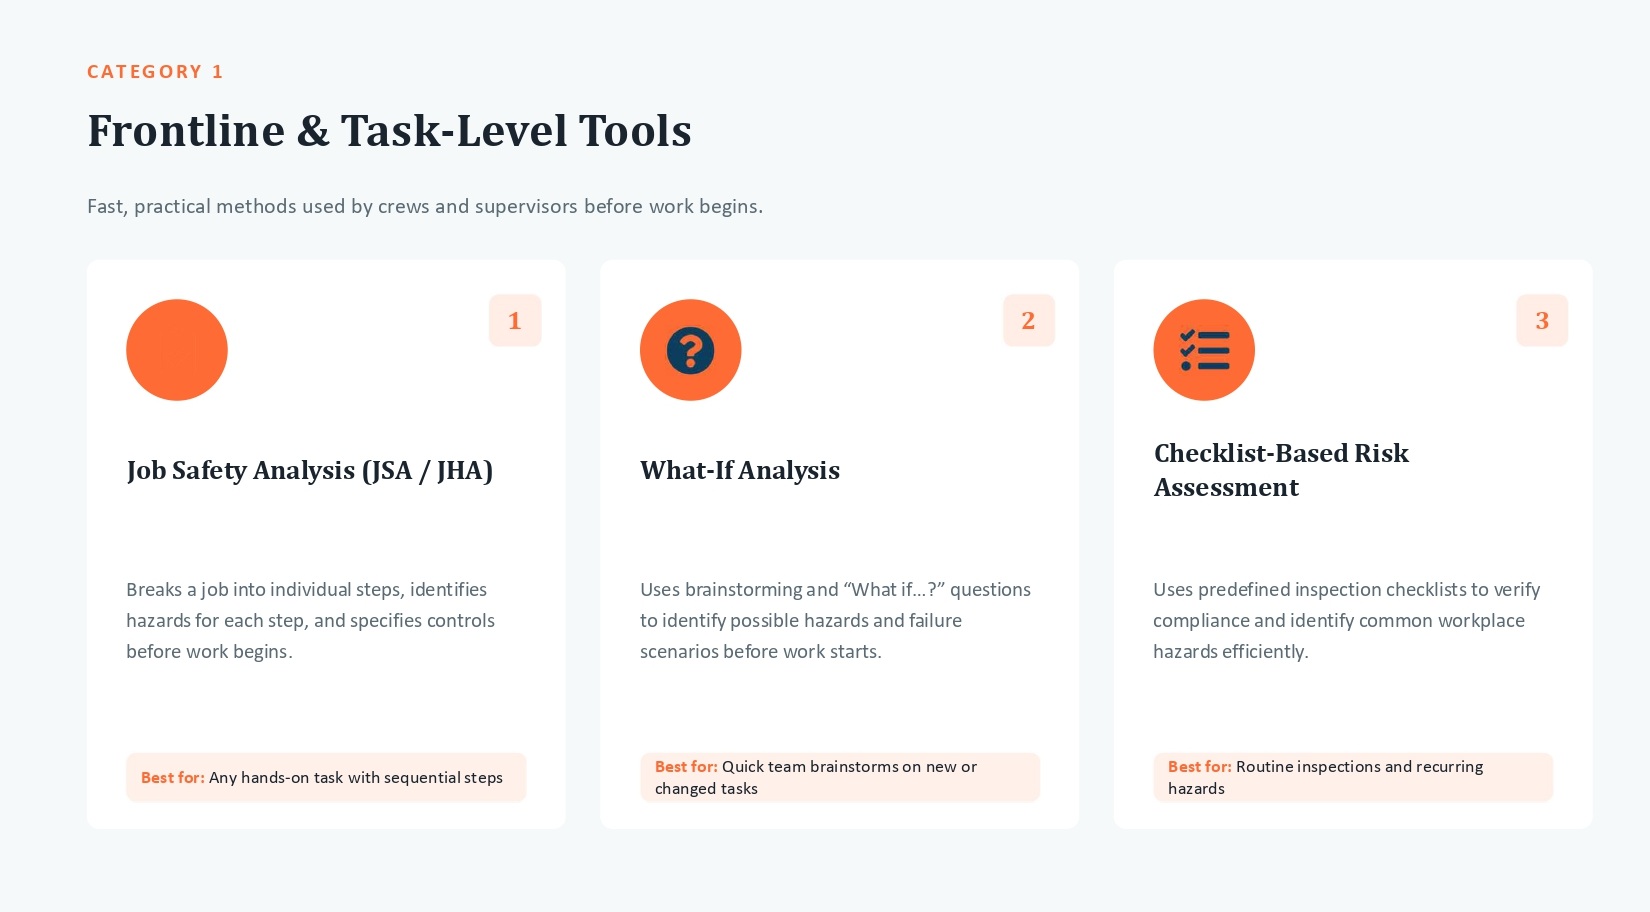
Job Safety Analysis (JSA), also called Job Hazard Analysis (JHA), breaks a single task down into its individual sequential steps and examines each step in isolation for potential hazards, rather than assessing the job as one broad activity. For every step, the analysis records the specific hazard present and the recommended safe procedure or control needed before that step is carried out. Because it works at step-by-step granularity, JSA is especially effective for non-routine or high-risk tasks such as confined space entry, working at height, or equipment lockout, and it is frequently used to brief workers immediately before the task begins, forming the basis of a toolbox talk or permit-to-work discussion.
Illustration: JSA/JHA Development Flow
Data Table: Sample JSA — “Changing a Vehicle Tire”
| Step | Task Sequence | Potential Hazard | Recommended Safe Procedure |
| 1 | Position vehicle & apply handbrake | Vehicle rolling | Park on level ground, engage handbrake, use wheel chocks |
| 2 | Loosen wheel nuts | Hand/wrist strain, tool slip | Use correctly sized wrench, maintain firm footing |
| 3 | Jack up vehicle | Vehicle falling off jack | Use rated jack on solid ground, jack stands as backup |
| 4 | Remove & replace wheel | Crushed fingers, heavy lifting | Keep fingers clear of hub, lift with legs not back |
| 5 | Lower vehicle & torque nuts | Wheel detachment if under-torqued | Torque nuts to spec in star pattern, re-check after driving |
Read More About
- Occupational Health and Safety: Management System
- Environment: Challenges, Management, and Sustainable Solutions
- First Aid Essentials: Everyone Must Know
IARCR – 5 Easy Steps to Remember
I – Identify the hazards
- What could cause harm?
A – Assess the risks
- Who could be harmed and how likely is it?
R – Reduce the risks
- Apply the hierarchy of controls to eliminate or minimize hazards.
C – Communicate and implement controls
- Inform workers, provide training, and put controls into practice.
R – Review regularly
- Monitor effectiveness and update the assessment when conditions change.
Memory Phrase
“Identify, Assess, Reduce, Communicate, Review.”
Or remember it as:
“I Assess Risks, Control & Review.”
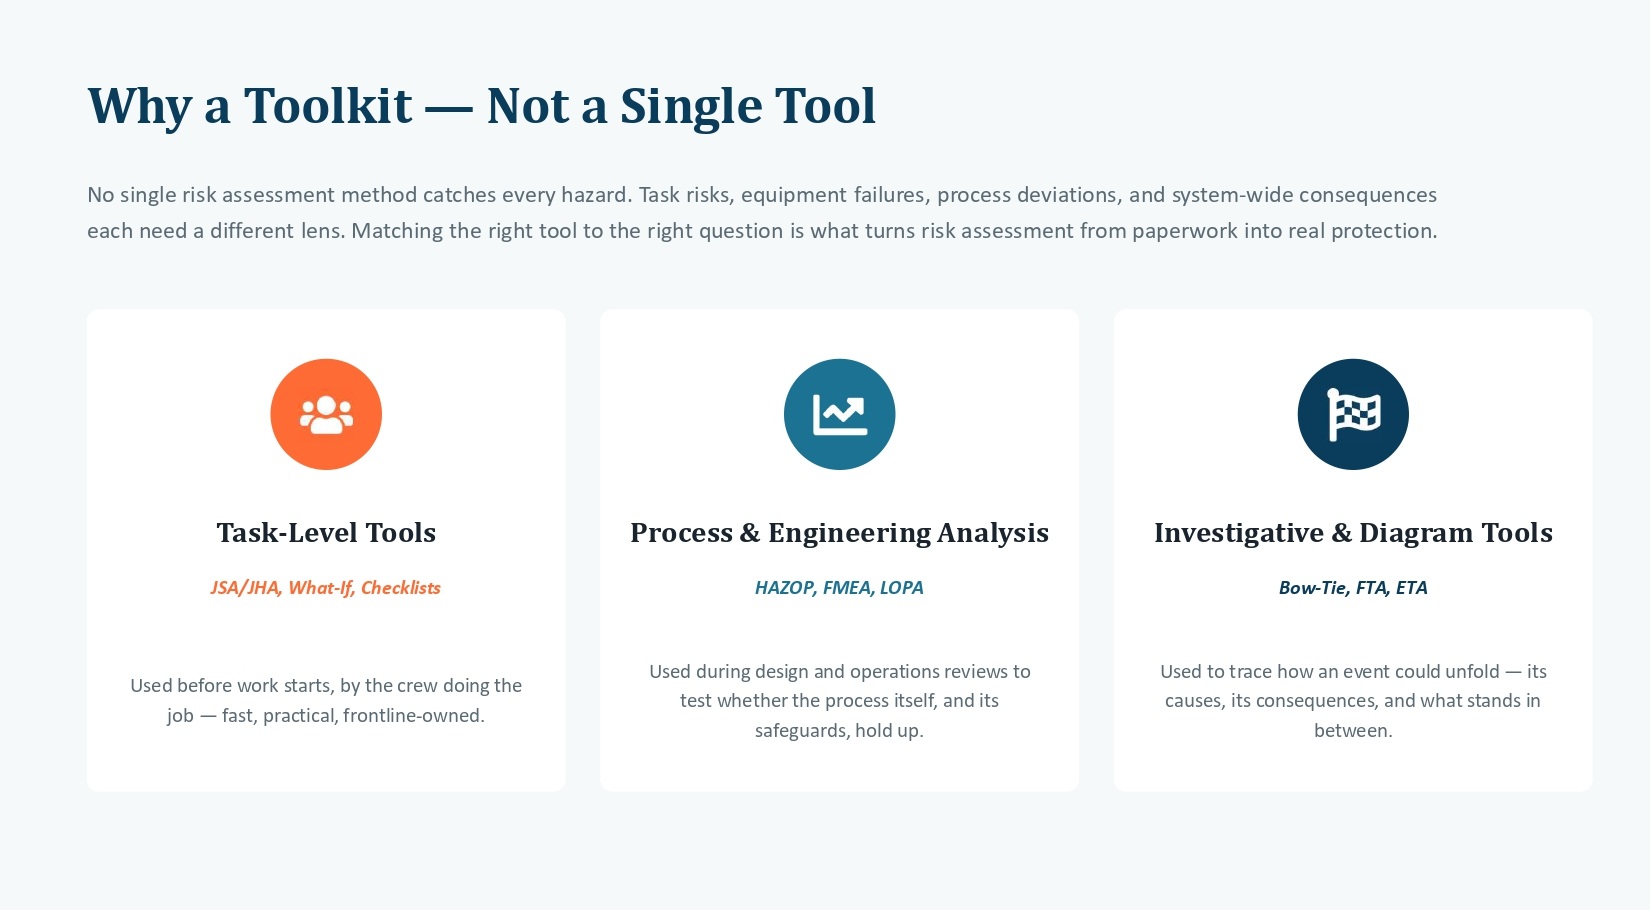
Risk Assessment Methods
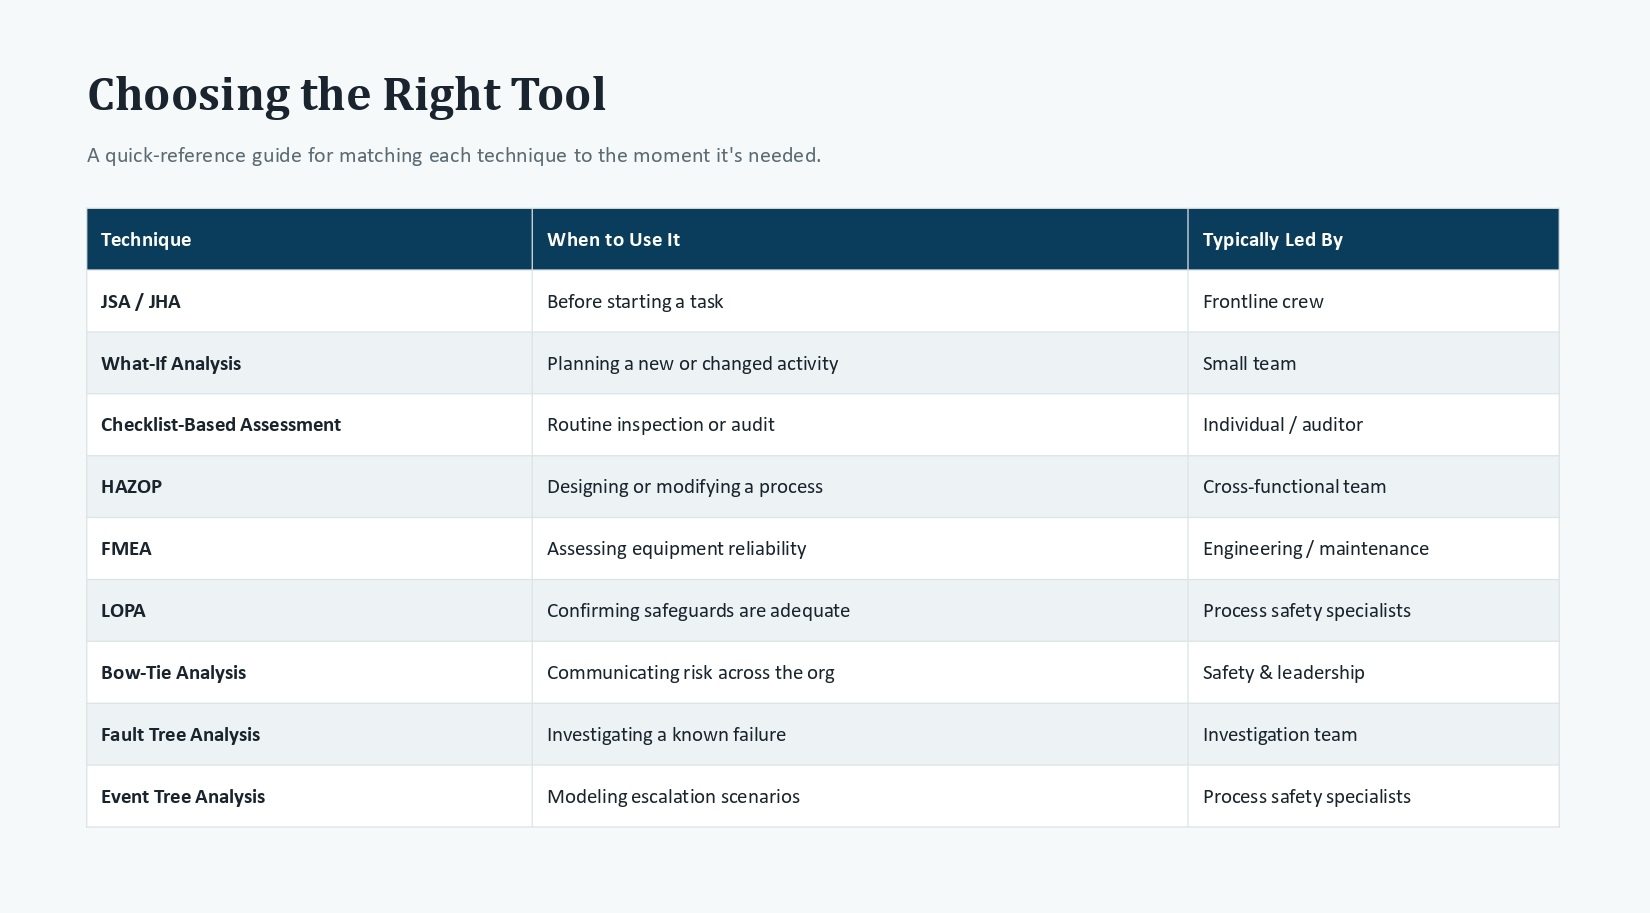
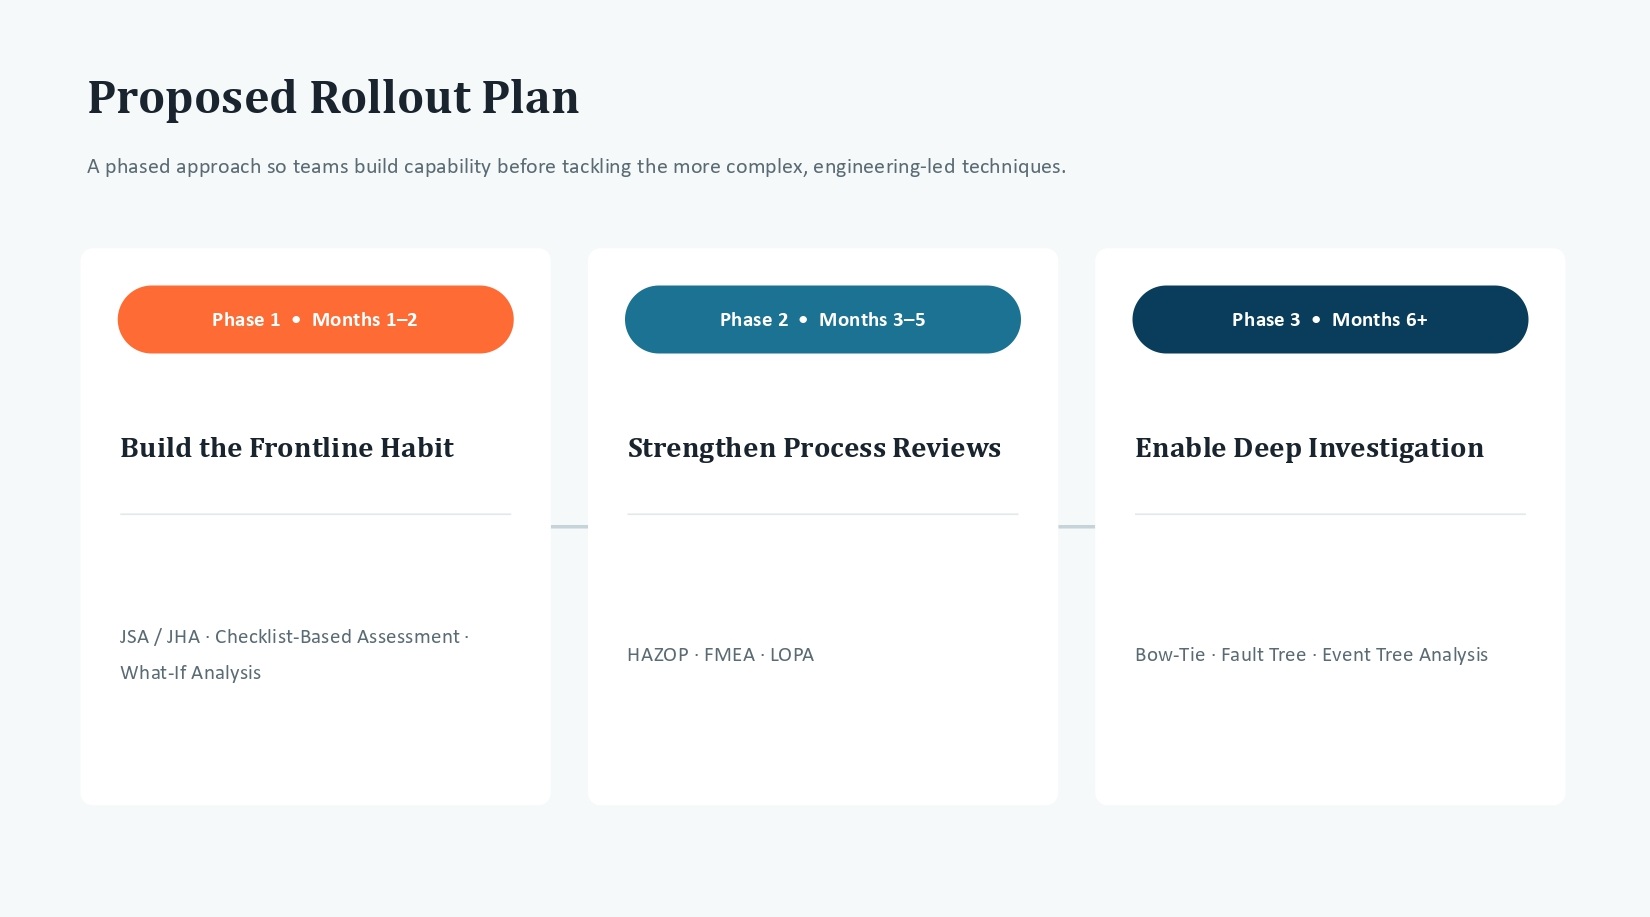
Risk Assessment Tools
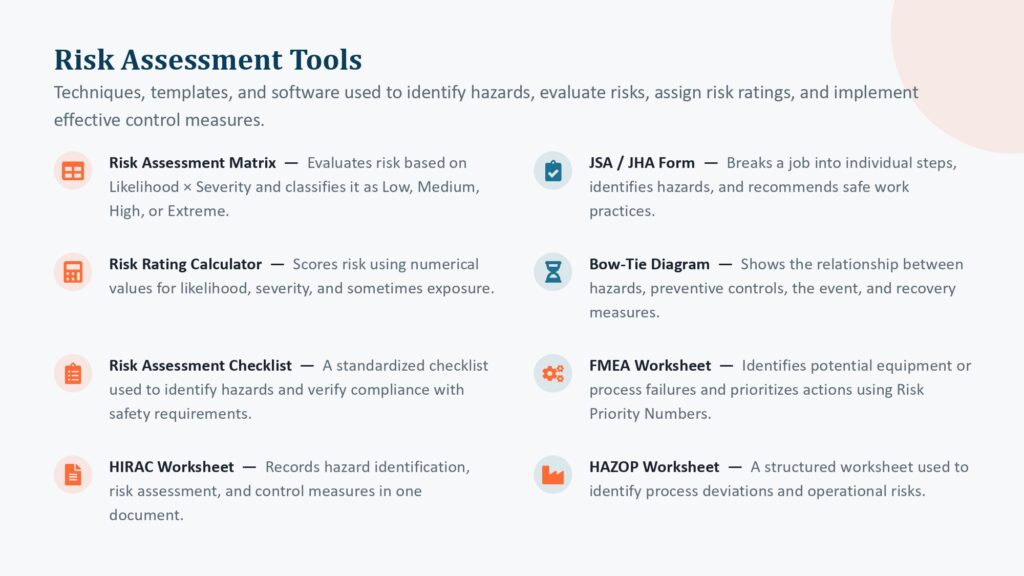
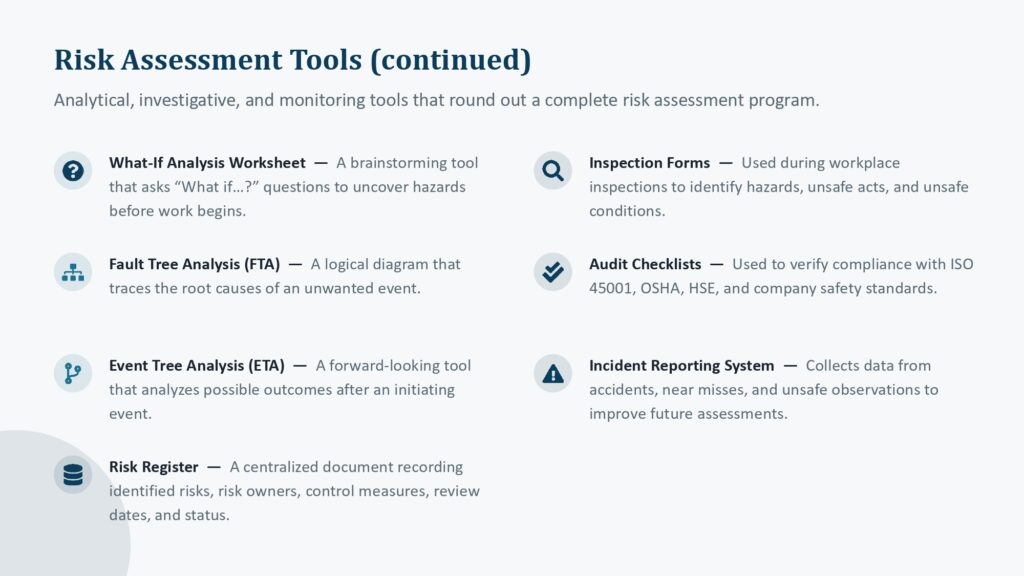
Digital Risk Assessment Software
Software platforms that automate hazard identification, risk scoring, reporting, and compliance management.
Here are the most widely used Risk Assessment Software platforms along with their official websites:
| Risk Assessment Software | Official Website |
|---|
| EcoOnline | EcoOnline |
| Safesite | Safesite |
| VelocityEHS | VelocityEHS |
| SafetyCulture (iAuditor) | SafetyCulture |
| Donesafe | Donesafe |
| ProcessMAP | ProcessMAP |
| Riskonnect | Riskonnect |
| BowTieXP | BowTieXP |
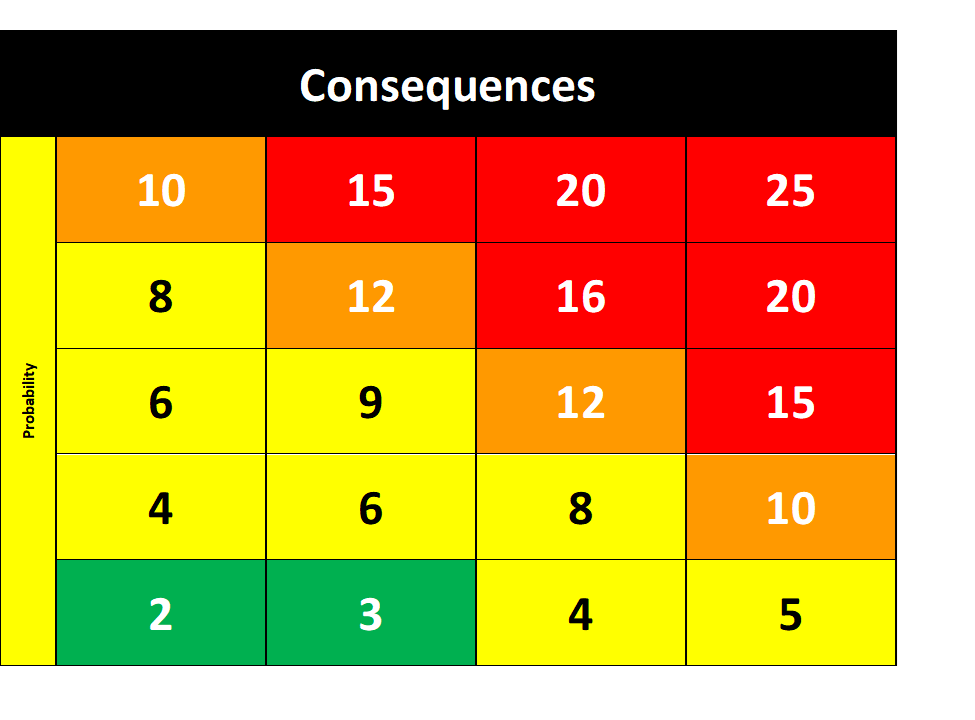
Risk Assessment Risk Rating
- Prioritizes hazards based on their level of risk.
- Supports informed decision-making.
- Helps allocate resources effectively.
- Ensures compliance with safety standards such as ISO 45001 and regulatory requirements.
- Reduces workplace injuries, incidents, and business disruptions.
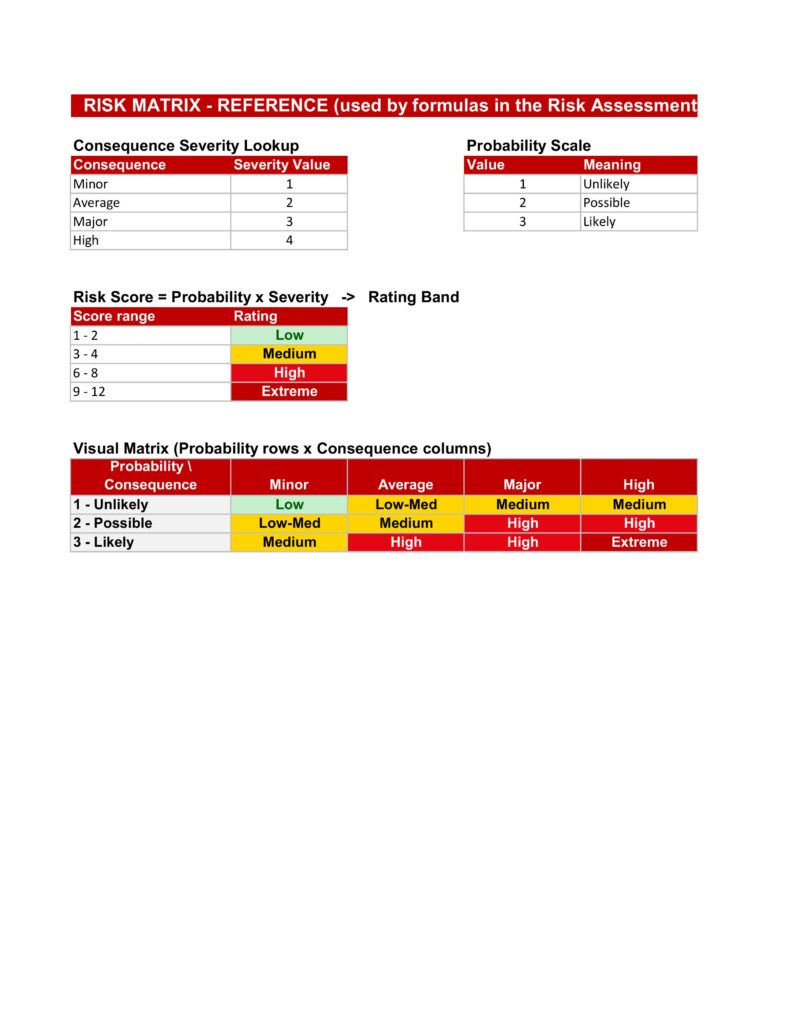
Risk Assessment Matrix / Table
Risk Assessment Method Statement (Download)
Risk Assessment Sample Template (Download)


 By
By