
Introduction
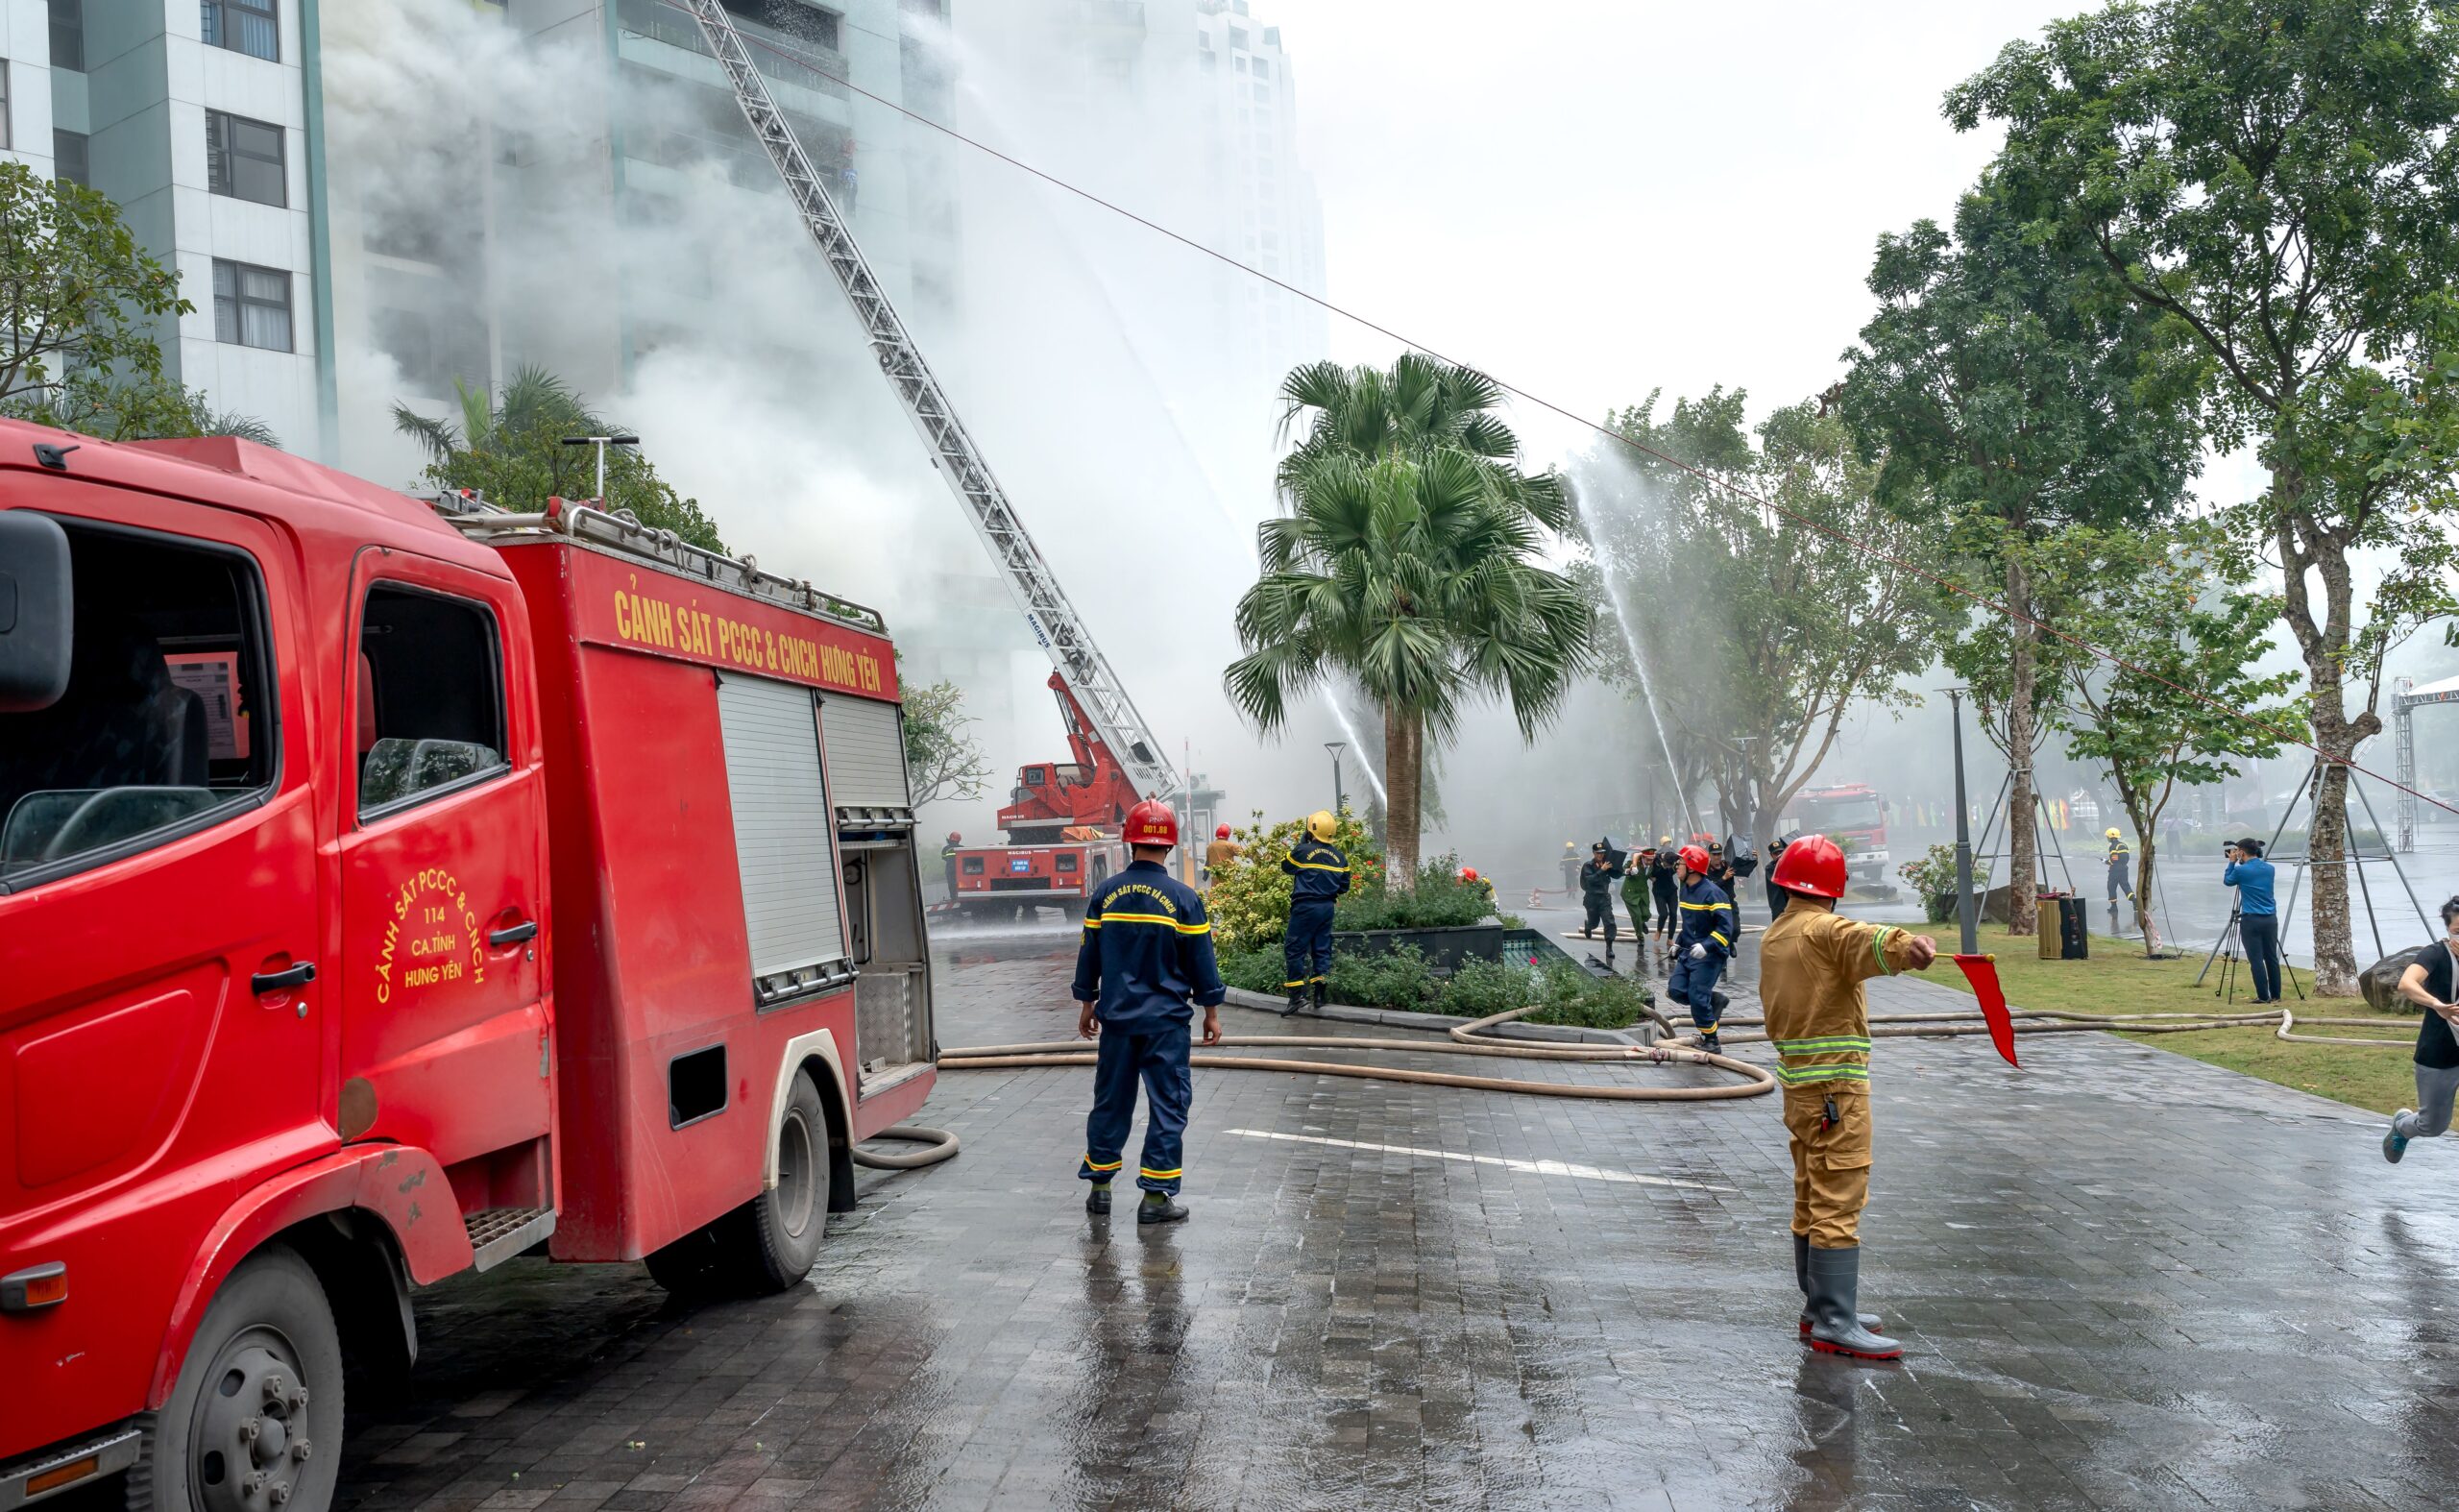
An Emergency Response Plan (ERP) is the backbone of organizational resilience. It is a formally documented, rehearsed, and continuously updated set of procedures designed to protect human life, safeguard assets, and maintain continuity of operations when an unplanned adverse event occurs. Whether the threat is a fire, a chemical spill, an active shooter, a natural disaster, a cyberattack, or a public health emergency, the presence of a well-trained Emergency Response Team (ERT) and a rehearsed plan is what separates a manageable incident from a catastrophe.
This essay examines the anatomy of an ERP and its associated ERT: who plans it, who executes it, how time is calculated and benchmarked during drills and real incidents, the different categories of emergencies an organization must prepare for, and what real-world case studies reveal about the effectiveness (or failure) of emergency response systems. Data tables and demographic breakdowns are included throughout to illustrate typical team composition, response-time benchmarks, and incident statistics, along with external reference links for further reading.
Table of Contents
1. What Is an Emergency Response Plan?
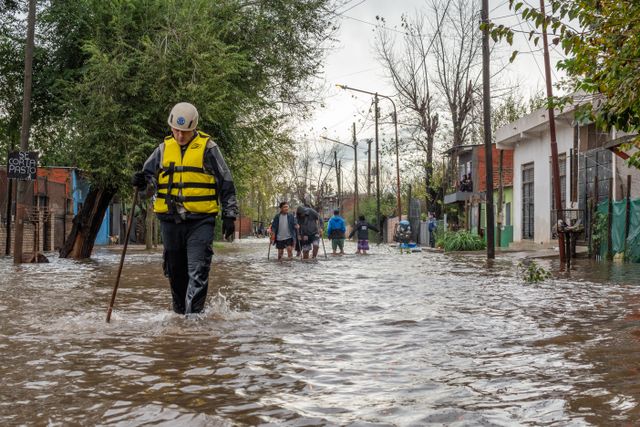
An Emergency Response Plan is a written document that:
- Identifies foreseeable hazards specific to a facility, region, or organization.
- Assigns clear roles and responsibilities before, during, and after an incident.
- Establishes a chain of command and communication protocols.
- Details evacuation routes, assembly points, and shelter-in-place procedures.
- Specifies resources (equipment, medical supplies, PPE, vehicles) required for response.
- Defines training, drill schedules, and plan-review cycles.
- Includes a recovery and after-action review process.
The plan is not a static document — it is a living system that must evolve with new hazards, staffing changes, facility modifications, and lessons learned from drills and real events. Most regulatory frameworks (OSHA in the United States, ISO 22301 for business continuity, and NFPA 1600 for disaster/emergency management) require periodic review, typically annually, and after any significant incident or near-miss.
2. The Emergency Response Team (ERT): Composition and Roles
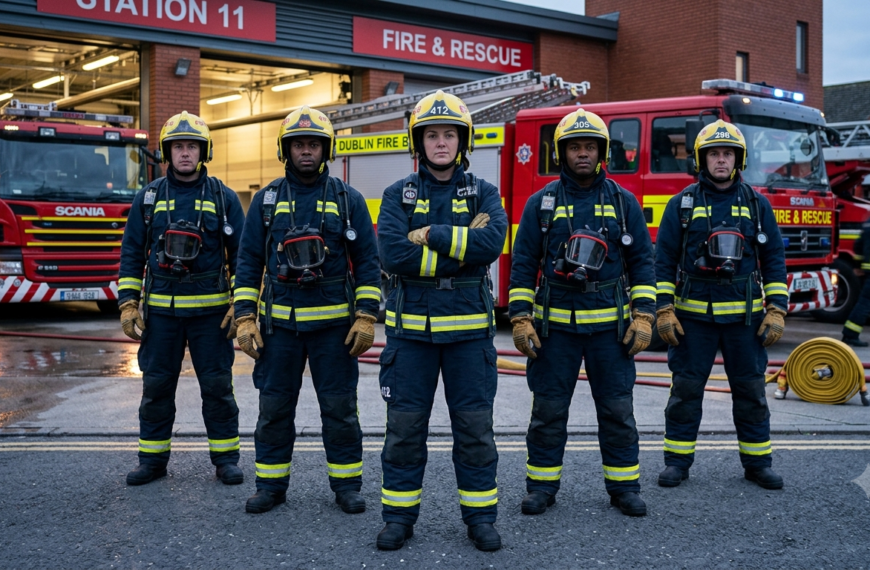
The ERT is the human infrastructure of the ERP. It is typically a cross-functional group drawn from various departments, trained specifically to execute the plan under pressure. Below is a typical organizational breakdown.
2.1 Core ERT Roles
| Role | Primary Responsibility | Typical Background |
|---|---|---|
| Incident Commander (IC) | Overall authority; declares emergency status, coordinates with external agencies | Senior facility/safety manager |
| Deputy Incident Commander | Backup to IC; manages logistics when IC is engaged with external liaison | Assistant safety manager |
| Fire Warden / Floor Marshal | Directs evacuation on assigned floor/zone, sweeps for stragglers | Trained employee volunteer |
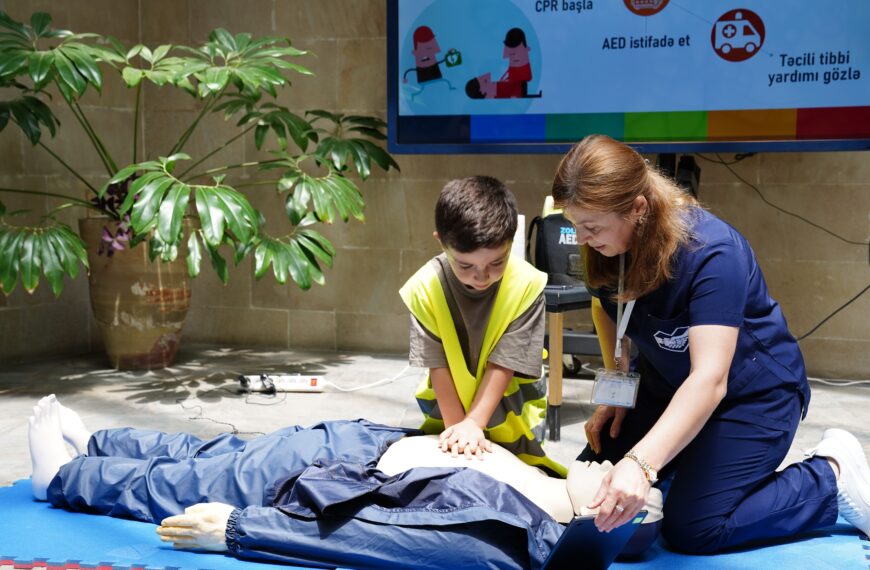
| First Aid / Medical Officer | Provides initial medical triage and stabilization | Certified in CPR/First Aid, sometimes EMT |
| Communications Officer | Manages internal alerts, external media, and family notification | HR or Corporate Communications |
| Security/Access Control Officer | Manages perimeter, controls entry/exit, coordinates with police | Facility security personnel |
| Logistics Officer | Manages equipment, transportation, shelter supplies | Operations/Facilities staff |
| Utilities/Engineering Officer | Shuts down gas, electrical, HVAC systems as needed | Maintenance/Engineering staff |
| Assembly Point Marshal | Takes headcount, reports missing persons to IC | Department supervisors |
| Scribe/Documentation Officer | Logs timeline of events for after-action report | Administrative staff |
2.2 Constituents Involved in Planning
Emergency Response Planning is never the job of a single department. Effective plans emerge from collaboration among:
- Executive Leadership — approves budget, sets risk tolerance, and ensures organizational buy-in.
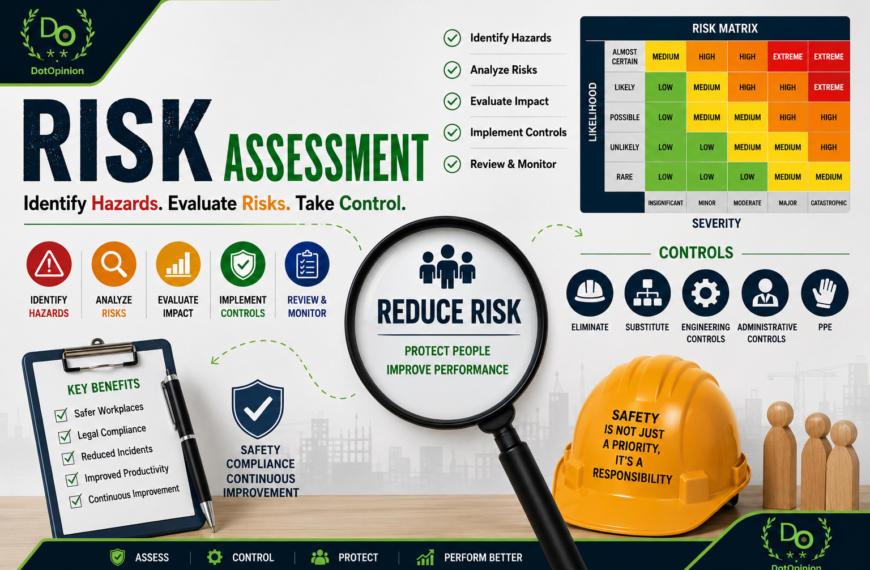
- Safety/Risk Management Department — conducts hazard identification and risk assessments (HIRA).
- Human Resources — manages personnel accountability, employee assistance programs, and family communication.
- Facilities/Engineering — provides input on structural vulnerabilities, utility shut-offs, and evacuation route design.
- IT/Cybersecurity — plans for business continuity in the event of system outages or cyber incidents.
- Legal/Compliance — ensures the plan meets regulatory requirements (OSHA, EPA, local fire codes).
- External Stakeholders — local fire departments, police, emergency medical services (EMS), and, for larger organizations, regional emergency management agencies (e.g., FEMA in the U.S., NDMA in India, NDMA in Pakistan).
- Employees/Occupants — the largest constituency; their training and behavioral compliance during drills determines real-world survivability.
2.3 Illustrative Demographic Breakdown of a Mid-Size ERT (500-employee facility)
| Demographic Category | Percentage of ERT Members | Notes |
|---|---|---|
| Age 18–30 | 22% | Often floor marshals, newer hires |
| Age 31–45 | 41% | Largest group; mid-career supervisors |
| Age 46–60 | 30% | Senior staff, often IC/Deputy IC roles |
| Age 60+ | 7% | Typically advisory or logistics roles |
| Gender: Male | 58% | — |
| Gender: Female | 41% | — |
| Gender: Non-binary/Other | 1% | — |
| Tenure < 2 years | 18% | Lower retention in ERT roles |
| Tenure 2–5 years | 35% | — |
| Tenure 5–10 years | 30% | — |
| Tenure 10+ years | 17% | Often training new recruits |
This kind of demographic tracking matters because research on organizational safety culture (e.g., studies published by the National Safety Council) consistently shows that ERTs with a broad mix of tenure and department representation respond more effectively, since institutional knowledge is paired with current facility familiarity.
3. Types of Emergencies and Response Categorization
Emergencies are typically grouped into categories, each requiring distinct procedures, equipment, and specialized training.
Read more about Environment
3.1 Natural Hazards
- Earthquakes
- Floods
- Hurricanes/Cyclones
- Wildfires
- Extreme heat/cold events
3.2 Technological/Man-Made Hazards
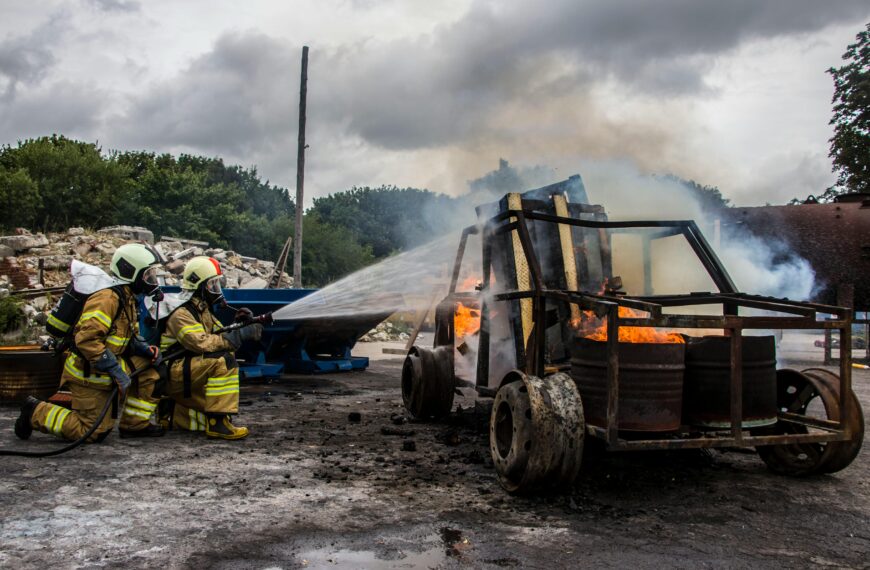
- Fire (structural)
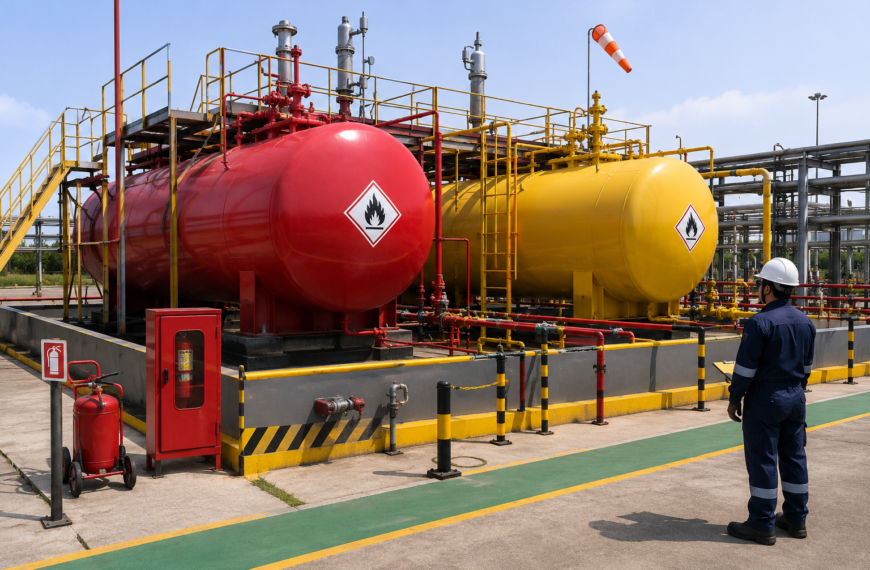
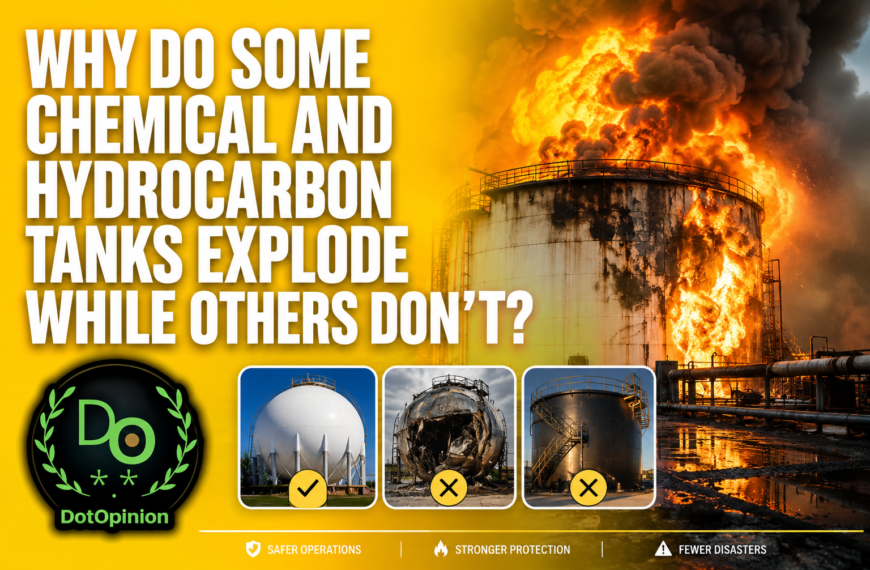
- Chemical spills/hazmat release
- Explosions
- Structural collapse
- Power/utility failure
3.3 Human-Caused Intentional Threats
- Active shooter/armed intruder
- Bomb threats
- Terrorism
- Workplace violence
- Cyberattacks/ransomware
3.4 Health-Related Emergencies
- Medical emergencies (cardiac arrest, injury)
- Infectious disease outbreak/pandemic
- Mass casualty events
3.5 Comparative Table: Emergency Type vs. Required Response Elements
| Emergency Type | Primary ERT Roles Activated | Typical External Agency | Average Facility Evacuation Requirement |
|---|---|---|---|
| Structural Fire | Fire Warden, Medical Officer, IC | Fire Department | Full evacuation |
| Earthquake | IC, Engineering Officer, Medical Officer | Search & Rescue, EMS | Partial/full depending on severity |
| Active Shooter | Security Officer, IC, Communications Officer | Police (SWAT) | Lockdown or run-hide-fight, not standard evacuation |
| Chemical Spill | Engineering Officer, Medical Officer, Security | Hazmat Team, Fire Dept | Zone-based evacuation |
| Cyberattack | IT/Cyber lead, Communications Officer, Legal | CISA/Law enforcement | No physical evacuation; business continuity activation |
| Pandemic/Outbreak | Medical Officer, HR, Communications | Public Health Department | Reduced occupancy/remote work activation |
4. Procedures: The Anatomy of a Response
A generic ERT procedure, regardless of hazard type, follows a five-phase cycle:
Phase 1: Detection & Notification
Alarms (fire, gas, security) or human observation triggers notification. Time-to-notification is the first metric measured in any incident review.
Phase 2: Assessment & Activation
The Incident Commander (or designated on-call authority) assesses severity and formally activates the ERP, mobilizing the relevant ERT roles.
Phase 3: Response & Containment
ERT members execute assigned tasks — evacuation, medical triage, utility shutdown, hazmat containment, lockdown, etc. — while the IC coordinates with arriving external responders.
Phase 4: Accountability & Communication
Assembly Point Marshals conduct headcounts; Communications Officer updates stakeholders, families, and (if needed) media and regulators.
Phase 5: Recovery & After-Action Review
Once the incident is stabilized, the facility transitions to recovery: damage assessment, restoration of operations, and a formal After-Action Report (AAR) capturing timeline, decisions made, and lessons learned.
5. Calculating ERT Response Time
Response time is arguably the single most important quantitative metric in emergency management, since survivability in most emergency categories (fire, cardiac arrest, active shooter) drops sharply as time elapses.
5.1 Key Time Intervals Measured
| Interval | Definition | Industry Benchmark |
|---|---|---|
| Detection Time | Time from event onset to alarm/notification | < 60 seconds (automated systems) |
| Notification Time | Time from detection to ERT alert dispatch | < 30 seconds |
| Mobilization Time | Time for ERT members to reach assigned posts | 2–5 minutes |
| Response/Containment Time | Time from mobilization to initial control action | Varies by hazard (see below) |
| Full Evacuation Time | Time for 100% of occupants to reach assembly point | Building-code dependent; often 3–13 minutes |
| External Agency Arrival Time | Time for fire/police/EMS to arrive on scene | Urban: 5–8 minutes; Rural: 10–20+ minutes |
5.2 A Simplified Response Time Formula
Total Incident Response Time (TIRT) can be modeled as:
TIRT = Td + Tn + Tm + Tr
Where:
- Td = Detection time
- Tn = Notification time
- Tm = Mobilization time
- Tr = Response/containment time
For example, in a structural fire scenario:
- Td = 45 seconds (smoke detector activation)
- Tn = 20 seconds (automated alarm broadcast)
- Tm = 3 minutes (fire warden reaches floor, begins evacuation)
- Tr = 6 minutes (fire department arrival and initial suppression)
TIRT ≈ 45s + 20s + 180s + 360s = 605 seconds (≈ 10.1 minutes)
This figure becomes the baseline against which drills are measured; any drill exceeding this by more than 20% typically triggers a plan review.
5.3 Sample Drill Time-Tracking Table (Quarterly Fire Drill Data, Fictionalized for Illustration)
| Quarter | Detection Time (sec) | Notification Time (sec) | Evacuation Time (min) | Headcount Completion (min) | Total Time (min) |
|---|---|---|---|---|---|
| Q1 | 50 | 25 | 6.2 | 8.5 | 8.8 |
| Q2 | 42 | 22 | 5.5 | 7.9 | 8.1 |
| Q3 | 38 | 18 | 4.9 | 6.8 | 7.2 |
| Q4 | 35 | 15 | 4.3 | 6.0 | 6.4 |
The steady improvement across quarters in this illustrative dataset reflects the value of repeated drilling: familiarity with evacuation routes and ERT role assignments compounds over successive exercises, a pattern widely documented in occupational safety literature.
5.4 Response Time by Hazard Type (Illustrative Industry Averages)
| Hazard Type | Average Detection-to-Response Time | Critical Threshold |
|---|---|---|
| Cardiac Arrest (Medical) | 1–3 minutes (AED deployment) | Survival drops ~10% per minute without defibrillation |
| Structural Fire | 5–10 minutes to full suppression start | Flashover can occur in 3–10 minutes |
| Active Shooter | 3 minutes average police arrival (US average) | Most incidents resolve within 5 minutes |
| Chemical Spill | 10–20 minutes for hazmat containment | Depends on chemical volatility |
| Earthquake (Search & Rescue) | Golden window: first 72 hours | Survival probability drops sharply after 72 hours |
6. Drills: Design, Frequency, and Evaluation
Drills are the mechanism by which an ERP transitions from a theoretical document to a tested, muscle-memory response capability.
6.1 Types of Drills
- Tabletop Exercises: Discussion-based, low-stress walkthroughs used primarily for planning-level ERT members (IC, department heads).
- Functional Drills: Test specific components (e.g., communications systems, medical response) without full-scale evacuation.
- Full-Scale Drills: Simulate an actual emergency with full ERT activation, evacuation, and often coordination with external responders.
- Unannounced Drills: Conducted without prior warning to test true readiness rather than rehearsed performance.
6.2 Recommended Drill Frequency
| Emergency Type | Recommended Drill Frequency | Common Standard Reference |
|---|---|---|
| Fire Evacuation | Quarterly (minimum twice/year in most jurisdictions) | NFPA 101 |
| Active Shooter/Lockdown | Annually, plus tabletop quarterly | DHS/CISA guidance |
| Earthquake | Semi-annually (in high-risk seismic zones) | FEMA guidance |
| Medical Emergency Response | Annually, with CPR/AED recertification | American Heart Association |
| Cyber Incident Response | Annually, with tabletop quarterly | NIST SP 800-61 |
| Pandemic/Outbreak Response | As needed, reviewed annually | WHO/CDC guidance |
6.3 Drill Evaluation Metrics
After each drill, planners typically score performance across:
- Time to full evacuation/lockdown compliance.
- Accuracy of headcount versus actual occupancy.
- Communication clarity (were all zones notified correctly?).
- Equipment functionality (alarms, extinguishers, AEDs, PA systems).
- ERT role adherence (did each member perform their assigned task?).
- Occupant behavior and comprehension of instructions.
7. Case Studies
7.1 Case Study: World Trade Center Evacuation (September 11, 2001)
One of the most studied emergency evacuations in modern history, the World Trade Center evacuation of September 11, 2001 revealed both strengths and critical weaknesses in high-rise emergency planning. Post-incident studies conducted by the National Institute of Standards and Technology (NIST) found that occupants who had participated in prior fire drills evacuated measurably faster and with less confusion than those without drill experience. However, the study also identified that pre-9/11 drills rarely simulated full-building evacuation from upper floors, meaning stairwell congestion and unfamiliarity with alternate exits significantly slowed descent times for many occupants. This case remains foundational in shaping modern high-rise evacuation codes, including revised stairwell width requirements and mandatory full-building drills in many jurisdictions. (See NIST NCSTAR 1-7 report, linked below.)
7.2 Case Study: Bhopal Gas Tragedy (1984)
The Bhopal disaster in India, involving the release of methyl isocyanate gas from a pesticide plant, is frequently cited as a case where the absence of an adequate community-facing emergency response plan compounded an industrial accident into a mass-casualty catastrophe. Investigations found that there was no functioning public alarm system to warn surrounding residential areas, and local hospitals had not been briefed on the chemical involved, delaying appropriate medical treatment. This case became a cornerstone for the development of community right-to-know laws and industrial hazard communication standards worldwide, including the U.S. Emergency Planning and Community Right-to-Know Act (EPCRA) of 1986.
7.3 Case Study: Fukushima Daiichi Nuclear Disaster (2011)
Following the 2011 Tōhoku earthquake and tsunami, the Fukushima Daiichi nuclear plant experienced a multi-reactor meltdown. Analyses by the International Atomic Energy Agency (IAEA) and Japan’s own investigative committees found that the plant’s emergency response plan had not adequately accounted for a tsunami of the height that occurred, and that backup power systems (critical for cooling systems) were themselves vulnerable to flooding. This case reinforced the importance of designing emergency plans around worst-case, low-probability scenarios rather than historically observed maximums — a principle now embedded in nuclear regulatory frameworks globally.
7.4 Case Study: Sandy Hook Elementary and the Evolution of School Lockdown Drills
Following the 2012 Sandy Hook Elementary School shooting, U.S. schools broadly adopted the ALICE (Alert, Lockdown, Inform, Counter, Evacuate) protocol, replacing older “lockdown-only” models. Research compiled by school safety organizations has since suggested that options-based protocols, where occupants are trained to assess and choose between lockdown, evacuation, or (as a last resort) countering a threat, tend to produce better outcomes than rigid single-response models. This case is frequently used in ERT planning courses to illustrate how drills and procedures must evolve based on evidence from prior incidents rather than remaining static.
7.5 Case Study Summary Table
| Case Study | Year | Primary Failure Identified | Resulting Policy/Practice Change |
|---|---|---|---|
| WTC Evacuation | 2001 | Insufficient full-building drill experience | Revised high-rise evacuation and stairwell codes |
| Bhopal Gas Tragedy | 1984 | No community alarm/hospital notification system | EPCRA and community right-to-know laws |
| Fukushima Daiichi | 2011 | Plan didn’t account for worst-case tsunami height | Nuclear plants required to plan for extreme low-probability events |
| Sandy Hook / School Safety | 2012 | Rigid single-response lockdown model | Adoption of options-based protocols (e.g., ALICE) |
8. Common Weaknesses Identified Across Case Studies
Reviewing these and other incidents, several recurring weaknesses emerge in failed or under-performing emergency response systems:
- Infrequent or unrealistic drills — plans that are written but never rehearsed under realistic time pressure.
- Poor external communication — community members, neighboring facilities, or partner hospitals not briefed on facility-specific hazards.
- Underestimation of worst-case scenarios — plans built around historical averages rather than credible worst-case events.
- Single-point-of-failure command structures — no clear deputy or succession plan if the Incident Commander is unavailable or incapacitated.
- Static procedures — failure to update plans based on new hazard information, staffing changes, or lessons from previous drills/incidents.
9. Building an Effective ERT: Recommendations
Based on the patterns above, several best practices consistently appear across high-performing emergency management programs:
- Redundancy in leadership roles. Every critical ERT role should have at least one trained backup.
- Realistic, varied drills. Mix announced and unannounced drills; simulate different times of day and occupancy levels.
- Cross-agency coordination. Regularly loop in local fire, police, and medical responders so they are familiar with the facility layout before a real emergency occurs.
- Data-driven review. Track response times quarter over quarter (as in the sample table above) and treat any regression as a trigger for retraining.
- Inclusive planning. Ensure the planning committee includes representation across departments, shifts, and demographics so blind spots (e.g., accessibility needs, night-shift staffing gaps) are identified early.
- Post-incident learning culture. Treat every drill and real incident, however minor, as a data point for continuous improvement rather than a compliance checkbox.
10. Conclusion
An Emergency Response Plan is only as strong as the team that executes it and the discipline with which that team rehearses. The case studies examined here — from the World Trade Center to Bhopal, Fukushima, and Sandy Hook — demonstrate a consistent lesson: organizations that treat emergency planning as a living, tested, and continuously revised system fare far better than those that treat it as a static compliance document. Time — measured in seconds and minutes across detection, notification, mobilization, and response — is the currency of survival in nearly every emergency category. Organizations that rigorously track, benchmark, and work to reduce these intervals, while building diverse, well-drilled, and redundantly-led ERTs, position themselves to protect both people and operations when the unexpected inevitably occurs.
External Reference Links
- Ready.gov — Emergency Response Plan Guidance (U.S. Department of Homeland Security)
- OSHA — Emergency Action Plans
- FEMA — Emergency Management Guide for Business and Industry
- NFPA 1600 — Standard on Continuity, Emergency, and Crisis Management: https://www.nfpa.org/codes-and-standards/1/6/0/0/nfpa-1600
- NIST — WTC Investigation Reports (NCSTAR): https://www.nist.gov/topics/disaster-failure-studies/world-trade-center
- CDC — Emergency Preparedness and Response: https://www.cdc.gov/orr/
- WHO — Emergency Response Framework: https://www.who.int/publications/i/item/9789240041030
- CISA — Active Shooter Preparedness: https://www.cisa.gov/topics/physical-security/active-shooter-preparedness
- NIST SP 800-61 — Computer Security Incident Handling Guide: https://csrc.nist.gov/pubs/sp/800/61/r2/final
- IAEA — Fukushima Daiichi Accident Report: https://www.iaea.org/publications/10962/the-fukushima-daiichi-accident
- American Heart Association — CPR & AED Guidelines: https://cpr.heart.org/
- U.S. EPA — EPCRA (Emergency Planning and Community Right-to-Know Act): https://www.epa.gov/epcra
Note: Illustrative data tables in this essay (drill time-tracking, demographic breakdowns, and quarterly response statistics) are representative examples constructed for educational purposes and should be replaced with an organization’s own measured data when used for actual emergency planning purposes.


 By
By