
Look outside your window. If you’re in a city, you might see a slight haze. If you’re near a wildfire, you might see a thick, ominous smoke. But even on a clear day, the air is not empty.
Floating in the air around us is a complex soup of solids and liquids. We call this particulate matter (PM) , and it’s one of the most dangerous—yet least understood—pollutants affecting our health.
Let’s pull back the curtain on this invisible threat.
What Exactly is Particulate Matter?
Simply put, particulate matter is the term for a mixture of solid particles and liquid droplets found in the air. Some particles are large or dark enough to be seen as soot or smoke, but many are microscopic and invisible to the naked eye.
These particles come in all shapes and sizes. To understand their impact, scientists categorize them by their aerodynamic diameter—basically, how small they are.
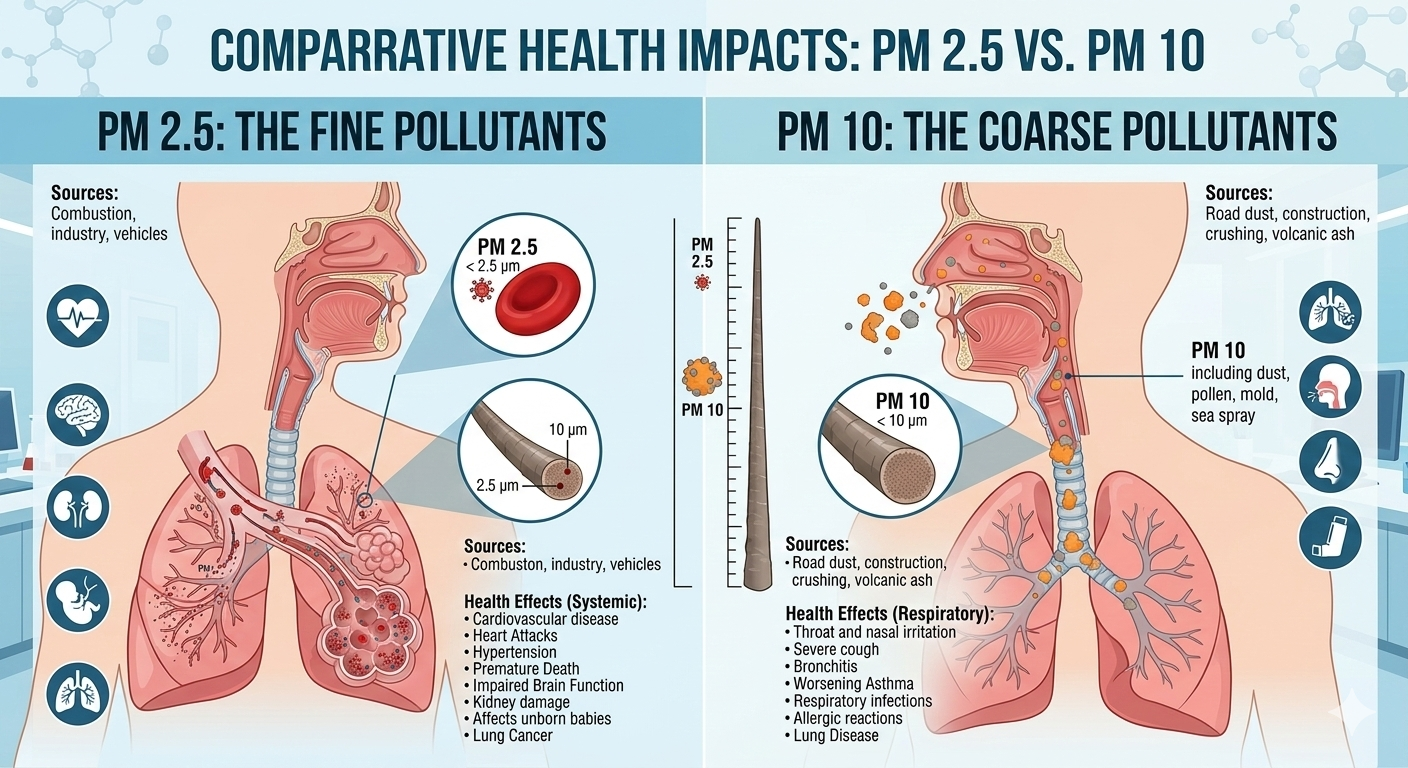
- PM10 (Inhalable Particles): These are particles with a diameter of 10 micrometers or smaller. Think of dust, pollen, and mold spores. For reference, a human hair is about 50–70 micrometers thick, so PM10 particles are still tiny.
- PM2.5 (Fine Inhalable Particles): These are the real troublemakers. PM2.5 refers to particles with a diameter of 2.5 micrometers or smaller. They are often referred to as “fine” particles.
To visualize this: if a PM2.5 particle were the size of a marble, a human hair would be the size of a redwood tree.
Where Does It Come From?
Particulate matter has two types of sources: primary and secondary.
Primary sources are emitted directly into the air. This includes:
- Construction sites: Unpaved roads and dusty work zones.
- Fields: Agricultural plowing and tilling.
- Roads: Dust kicked up by traffic.
- Fires: Wildfires, wood-burning stoves, and controlled burns.
- Industrial sources: Power plants, factories, and smokestacks.
Secondary sources are formed in the atmosphere through complex chemical reactions. Gases emitted from power plants, industries, and vehicles (like sulfur dioxide and nitrogen oxides) react with sunlight and water vapor to form fine particle “soups.”
The Health Danger: Why Size Matters
The danger of particulate matter is directly linked to its size. Your body has excellent defenses against large particles—nose hairs and mucus can trap and expel them.
But PM2.5? They are small enough to bypass these defenses entirely.
- Inhalation: You breathe them in.
- Deep Penetration: They travel past your throat and into the deepest parts of your lungs—the alveoli, where oxygen enters your bloodstream.
- Crossing the Barrier: Because they are so tiny, PM2.5 particles can actually pass through the lung tissue and enter your bloodstream.
Once inside your body, these particles can cause inflammation and damage to nearly every organ. Short-term exposure can lead to irritation of the eyes, nose, and throat, as well as coughing and shortness of breath. Long-term exposure is linked to far more serious issues:
- Aggravated asthma
- Decreased lung function
- Heart attacks and strokes
- Respiratory issues in children
How to Check Your Air Quality
You don’t need to guess how polluted your air is. Most weather apps and websites now report the Air Quality Index (AQI) .
The AQI is a scale from 0 to 500. The higher the number, the greater the level of air pollution and the greater the health concern.
- 0–50 (Green): Good. Air quality is satisfactory.
- 51–100 (Yellow): Moderate. Acceptable, but there may be a risk for people who are unusually sensitive to air pollution.
- 101–150 (Orange): Unhealthy for Sensitive Groups.
- 151–200 (Red): Unhealthy. Everyone may begin to experience health effects.
- 201+ (Purple/Maroon): Very Unhealthy to Hazardous. This triggers health alerts and everyone is likely to be affected.
5 Ways to Protect Yourself and Your Family
While we can’t control the outdoor air entirely, we can control our exposure.
1. Stay Informed
Check your local AQI daily, just like you check the weather. If you plan a run or a bike ride, do it early in the morning when pollution levels are often lower, or wait until the AQI improves.
2. Invest in an Air Purifier
Since we spend about 90% of our time indoors, cleaning your indoor air is crucial. Look for a purifier with a HEPA filter. These are mechanical filters that force air through a fine mesh and trap 99.97% of particles, including PM2.5.
3. Mask Up on Bad Air Days
Not all masks are created equal. A standard cloth or surgical mask does little to block fine particles. If you must be outside when the AQI is unhealthy, wear an N95 or KN95 respirator. These are designed to form a seal around your nose and mouth and filter out fine particulate matter.
4. Create a Clean Air Space
When pollution levels spike (like during wildfire season), keep windows and doors closed. If you don’t have an air purifier, you can build a DIY box fan filter (often called a Corsi-Rosenthal box) by taping a MERV-13 furnace filter to the back of a standard box fan. It’s surprisingly effective and affordable.
5. Reduce Your Contribution
Be mindful of your own impact. Avoid burning wood or trash. Opt to walk, bike, or take public transit instead of driving when possible. Support policies and leaders who prioritize clean air and renewable energy.
1. The Environmental and Economic Impact
The post currently focuses heavily on personal health. Broadening the scope shows the reader that this isn’t just a “me” problem, but a “we” problem.
- Ecosystem Damage: Explain how particulate matter settles on soil and water, changing nutrient balance and harming aquatic life. It can also damage crops and reduce agricultural yields.
- Climate Change Connection: Mention that some particles (like black carbon/soot) absorb sunlight and contribute to atmospheric warming, while others can influence cloud formation.
- Economic Cost: Briefly touch on the financial burden—healthcare costs for pollution-related illnesses, lost workdays due to sickness, and reduced crop productivity.
2. The Global Disparity (Environmental Justice)
This adds a crucial layer of context and social relevance.
- Unequal Burden: Note that air pollution doesn’t affect everyone equally. Low-income communities and communities of color are often located near highways, ports, factories, and power plants, exposing them to higher levels of particulate matter.
- Global Comparison: Mention that while many Western countries have improved air quality through regulation, rapid industrialization in other parts of the world (like South Asia) has led to some cities having AQI levels that are literally off the charts.
3. Specificity for Vulnerable Groups
The “Unhealthy for Sensitive Groups” warning is mentioned, but you could expand on who those groups are and why they are at higher risk to help readers identify if they or their family members need to be extra cautious.
- Children: Their lungs are still developing, and they breathe more rapidly than adults, taking in more air relative to their body size.
- The Elderly: Natural defense mechanisms weaken with age, and underlying health conditions are more common.
- Pregnant People: Studies have linked PM exposure to low birth weight and preterm birth.
- Outdoor Workers: Construction workers, landscapers, and delivery drivers who spend 8+ hours a day outside cannot avoid exposure as easily as someone in an office.
4. Practical Home Hacks (Beyond the Purifier)
While you mentioned keeping windows closed and DIY filters, you could add a short checklist for indoor air hygiene.
- Shoes Off Policy: A huge amount of PM (especially PM10 from dust and soil) is tracked into the house on shoes. A simple “no shoes inside” rule significantly reduces indoor particulate levels.
- Vacuuming: Advise readers to use a vacuum cleaner with a HEPA filter. Regular vacuums can actually kick dust back into the air.
- Humidity Control: Maintaining indoor humidity between 30-50% can help particles settle out of the air faster (though be careful not to let it get too high and cause mold, which is also a pollutant).
5. Busting Common Myths
Adding a “Myth vs. Fact” section is great for engagement and correcting misinformation.
- Myth: “I can’t see the pollution, so the air must be fine.” Fact: PM2.5 is invisible. Clear skies do not equal clean air.
- Myth: “Wearing a regular surgical mask is enough protection.” Fact: Surgical masks are designed to protect others from your droplets, not to filter the tiny particles you breathe in. Only N95s or better work for PM2.5.
- Myth: “Staying indoors keeps me 100% safe.” Fact: Indoor air can be 2-5 times more polluted than outdoor air (due to cooking, candles, dust mites) unless you are actively filtering it.
6. A Strong Call to Action (CTA)
How do you want the reader to feel after reading this? Empowered? Worried? Activated?
- Personal CTA: “Check your AQI right now before you go outside today.”
- Advocacy CTA: “Call your local representatives and ask them to support [specific clean air policy].”
- Community CTA: “Share this article with a friend who jogs on the highway or a parent who is worried about their child’s asthma.”
Summary Checklist
If you want to update the draft, here is a quick list of the specific paragraphs/sections you could insert:
- A paragraph after “Where Does It Come From?” regarding the Environmental Impact.
- A sub-section within “The Health Danger” breaking down risks for Children, Elderly, and Outdoor Workers.
- A “Quick Tips” box near the “Protect Yourself” section listing the Shoes Off and HEPA Vacuum hacks.
- A final paragraph at the very end serving as a Call to Action.
By adding these elements, you turn the blog from a simple “explainer” into a comprehensive resource that acknowledges the complexity of the issue while remaining helpful.
Data Visualizations: A Closer Look at the Numbers
1. Table: Evolution of U.S. Air Quality Standards (PM2.5)
To understand how serious health agencies are about particulate matter, look no further than the National Ambient Air Quality Standards (NAAQS). Over the years, as scientific research has solidified the link between fine particle pollution and health risks, the standards have been tightened significantly. The table below shows how the acceptable level of PM2.5 in the air has been lowered over time .
| Standard | 1997 – 2006 | 2006 – 2012 | 2012 – 2024 | 2024 – current |
|---|---|---|---|---|
| 24-hour | 65 µg/m³ | 35 µg/m³ | 35 µg/m³ | 35 µg/m³ |
| Annual | 15 µg/m³ | 15 µg/m³ | 12 µg/m³ | 9 µg/m³ |
What this means for you: The latest standard (2024-current) now requires the annual average PM2.5 concentration to be no more than 9 µg/m³, a significant drop from the 12 µg/m³ limit set in 2012. This means that air previously considered marginally safe is now understood to pose greater long-term health risks.
2. Graph: The U.S. Success Story (1990 – 2015)
It’s not all bad news. Stringent regulations like the Clean Air Act have had a profoundly positive effect. According to data from the EPA and NASA, the average concentration of PM2.5 in the U.S. dropped dramatically between 1990 and 2015 .
While we cannot display a live interactive chart here, the data tells a powerful story:
- 1990: PM2.5 baseline concentration.
- 2015: PM2.5 concentration had decreased by 37% .
This downward trend, also observed in satellite data showing a 30% reduction in the Eastern U.S. from 1998 to 2012 , proves that policy changes and technological advances in filtering power plants and vehicles make a tangible difference.
3. Graph: A Tale of Two Continents (2005 – 2017)
While the U.S. and Europe have been cleaning up their air, the situation in other parts of the world has shifted dramatically. NASA satellite data on Sulfur Dioxide (SO2)—a key precursor to particulate matter—shows opposite trends in China and India .
- China (2005-2016): Rapid decrease in SO2. This is the result of aggressive government policies to cap coal consumption and install scrubbers in power plants.
- India (2005-2016): Rapid increase in SO2. This reflects the country’s heavy reliance on coal-fired power plants to fuel its economic growth, without the same level of emission controls.
4. Table: Global Health Impact
To put the danger of PM2.5 into perspective, we have to look at the global mortality figures. These numbers help explain why the WHO and global health agencies are so focused on air quality .
| Statistic | Value |
|---|---|
| Estimated premature deaths annually (outdoor trace gases) | ~ 4 million |
| Estimated premature deaths annually (indoor trace gases) | ~ 3-4 million |
| Total fraction of global deaths attributed to trace gases | 1 in 9 |
Key Takeaway: The vast majority of these deaths are linked to fine particulate matter (PM2.5) , cementing its status as one of the top environmental health risks in the world .
5. The Economic Argument for Clean Air
For those who are motivated by economics rather than health, the data is just as compelling. Investing in clean air isn’t just a cost; it yields massive returns.
According to the EPA, the benefits of air quality mitigation more than 30 times exceed the associated costs. Specifically :
- Annual Cost to improve air quality: ~$65 billion.
- Resulting Economic Benefit: ~$2 trillion due to reduced premature mortality and increased economic production.
The air we breathe is a shared resource. By understanding threats like particulate matter, we can make smarter choices for our personal health and advocate for a cleaner future for everyone.
Breathe easy (and informed)!