💡 Introduction: Turning Market Data into Smart Decisions
When prices move up and down, traders look for meaning in the chaos.
That’s where Technical Analysis (TA) comes in — a data-driven approach that studies price charts, patterns, and indicators to forecast future market behavior.
Unlike Fundamental Analysis, which looks at what an asset is worth, Technical Analysis focuses on how the market behaves.
It helps traders decide when to buy, sell, or hold by interpreting signals hidden in the charts.
Whether you’re trading cryptocurrency, stocks, or forex, mastering Technical Analysis can turn random market swings into informed trading opportunities.
🔍 1. What Is Technical Analysis?
Technical Analysis (TA) is a method of evaluating assets based on historical price data and trading volume.
The core belief:
“Price reflects all available information.”
TA assumes that market trends tend to repeat themselves — meaning past price movements can offer clues about future behavior.
In simple terms:
👉 It’s the study of market psychology through charts.
🧠 2. The Core Principles of Technical Analysis
⚙️ A. Market Action Discounts Everything
Prices already include every factor — economic news, fundamentals, and investor sentiment.
Hence, analyzing charts is enough to gauge market behavior.
📊 B. Prices Move in Trends
Markets don’t move randomly — they move in trends:
- Uptrend: Higher highs and higher lows
- Downtrend: Lower highs and lower lows
- Sideways (Range): Consolidation before breakout
🔁 C. History Repeats Itself
Patterns formed in the past often reappear because human psychology — fear and greed — never changes.
🧩 3. Key Components of Technical Analysis
🔹 A. Price Charts
Charts visualize price data over time and form the base of TA.
Types of Charts:
- Line Chart: Simplest form, connects closing prices.
- Bar Chart: Shows open, high, low, and close (OHLC).
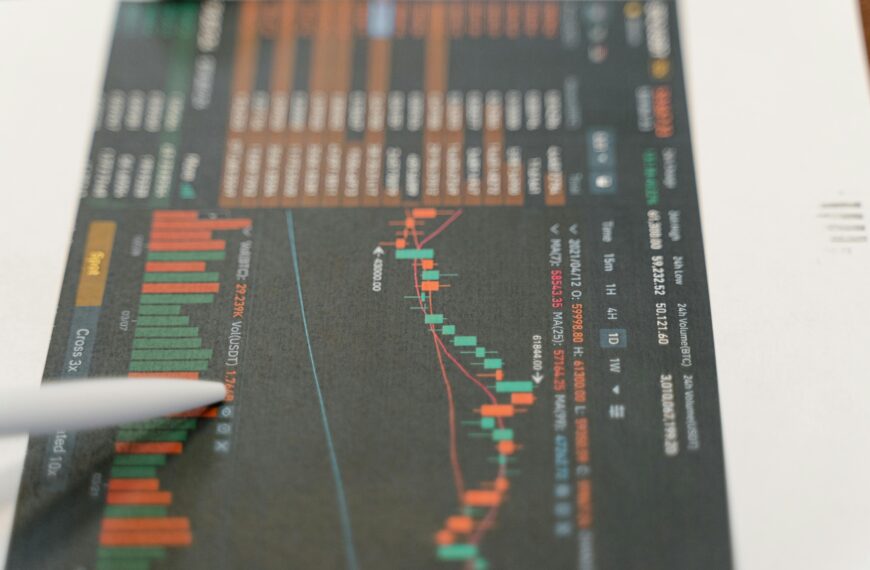
- Candlestick Chart: Most popular — visualizes market emotions through “candles.”
💡 Each candle tells a story of battle between buyers (bulls) and sellers (bears).
🔹 B. Time Frames
Different time frames offer different insights:
- 1m / 5m / 15m: For short-term traders (scalpers).
- 1h / 4h: For swing traders.
- 1D / 1W / 1M: For long-term investors.
The bigger the time frame, the more reliable the trend.
🔹 C. Trends and Trendlines
A trendline connects key highs or lows to identify market direction.
- Uptrend line: Connects higher lows.
- Downtrend line: Connects lower highs.
Breakouts above or below trendlines often signal reversals or new moves.
📉 4. Technical Indicators and Tools
Indicators transform raw price data into signals that help traders make decisions.
🧭 Momentum Indicators
Measure the speed and strength of price movements.
- RSI (Relative Strength Index): Identifies overbought (>70) or oversold (<30) conditions.
- MACD (Moving Average Convergence Divergence): Detects momentum shifts and crossovers.
- Stochastic Oscillator: Compares closing prices to recent ranges.
📈 Trend Indicators
Confirm the direction and strength of trends.
- Moving Averages (SMA, EMA): Smooth out price data.
- Example: 50-day and 200-day moving averages.
- Average Directional Index (ADX): Measures trend strength, not direction.
📊 Volume Indicators
Volume shows the strength behind price movements.
- On-Balance Volume (OBV): Tracks cumulative volume to spot breakouts.
- Volume Moving Average: High volume with price rise = strong move.
💵 Volatility Indicators
Measure the rate of price fluctuation.
- Bollinger Bands: Identify overbought/oversold zones by tracking standard deviations.
- ATR (Average True Range): Shows market volatility — high ATR means large price swings.
🔎 5. Popular Chart Patterns
Patterns are visual formations that repeat due to collective trader behavior.
🔺 Continuation Patterns:
Signal that a trend will likely continue.
- Triangles (Ascending, Descending, Symmetrical)
- Flags and Pennants
- Rectangles (Consolidation)
🔻 Reversal Patterns:
Indicate possible trend change.
- Head and Shoulders (trend reversal)
- Double Top / Double Bottom
- Cup and Handle
💡 The longer the pattern takes to form, the stronger the potential breakout.
💬 6. Candlestick Patterns
Candlestick analysis helps traders read market psychology in real time.
✅ Bullish Patterns:
- Hammer: Indicates potential reversal after a downtrend.
- Bullish Engulfing: Big green candle overtakes previous red one.
- Morning Star: Three-candle reversal signal.
❌ Bearish Patterns:
- Shooting Star: Potential reversal at the top.
- Bearish Engulfing: Red candle covers prior green one.
- Evening Star: Three-candle bearish reversal.
📚 7. Support and Resistance
- Support: A price level where buying pressure prevents further decline.
- Resistance: A level where selling pressure prevents further rise.
When price breaks through these levels, it often signals a trend continuation or reversal.
💡 Support turns into resistance after a breakdown — and vice versa.
🧮 8. Combining Tools for Better Accuracy
Professional traders rarely rely on one indicator.
They combine several for confirmation — known as confluence trading.
Example Setup:
- Identify trend (Moving Averages)
- Check RSI for overbought/oversold
- Confirm with Volume and MACD crossover
This layered approach filters false signals and improves trade accuracy.
⚖️ 9. Limitations of Technical Analysis
- Subjectivity: Patterns can be interpreted differently.
- No Fundamental Context: It ignores project fundamentals or news.
- False Breakouts: Markets can behave unpredictably due to manipulation or low liquidity.
That’s why many traders combine Technical Analysis (for timing) with Fundamental Analysis (for selection).
🧭 10. Why Technical Analysis Matters
- Helps identify entry and exit points.
- Builds discipline and strategy over emotion.
- Offers a visual roadmap of market psychology.
- Works across all asset classes — crypto, stocks, forex, and commodities.
💡 Technical Analysis doesn’t predict the future — it prepares you for it.
🔚 Conclusion: Reading the Market Like a Pro
Technical Analysis turns raw price data into insight.
By mastering charts, patterns, and indicators, you gain the ability to see opportunities others miss — and avoid emotional trading decisions.
In today’s fast-moving crypto markets, those who understand technical signals hold the real advantage.

 By
By